Tuesday, July 26, 2011
Updates On Economic Indicators July 2011
Here is an update on various indicators that are supposed to predict and/or depict economic activity. These indicators have been discussed in previous blog posts:
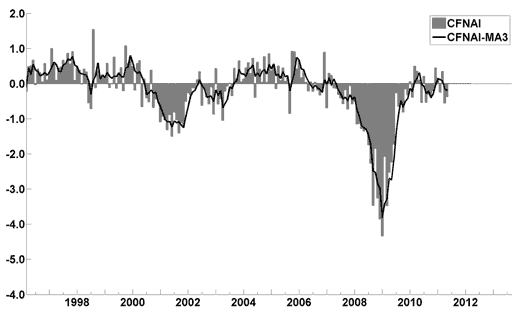
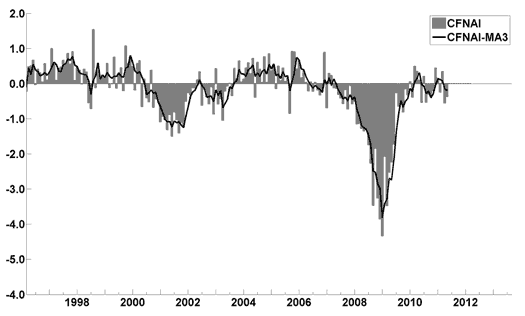
The July Chicago Fed National Activity Index (CFNAI)(pdf) updated as of July 25, 2011:
-
-
An excerpt from the June 22 Press Release, titled “Index forecasts stronger growth this fall” :
The June update of the USA TODAY/IHS Global Insight Economic Outlook Index shows real GDP growth, at a six-month annualized growth rate, remaining below 3% through the summer and then gaining strength in October and November with 3.3%-3.4% growth rates. Temporary automotive supply disruptions resulting from the Japan earthquake plus high energy and food prices are the main reasons for the slowdown. A return to stronger growth is expected in the fall as automotive supply levels return to normal, businesses increase equipment spending, export growth remains strong and employment slowly improves. The weak housing market and concerns about European debt remain drags on the recovery.
-
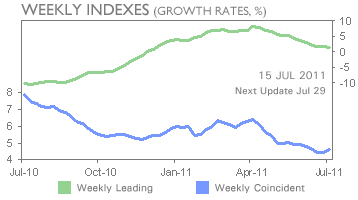
As of 7/15/11 the WLI was at 127.5 and the WLI, Gr. was at 1.7%. A chart of the growth rates of the Weekly Leading and Weekly Coincident Indexes:
-
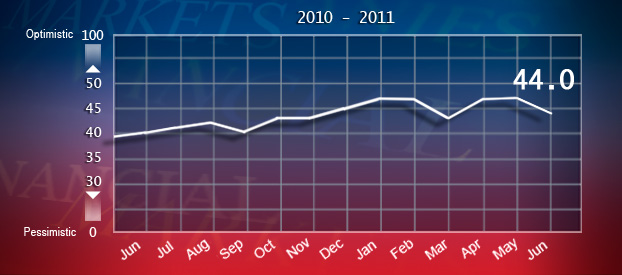
The Indicator as of June 30 was at 44.0, as seen below:
-
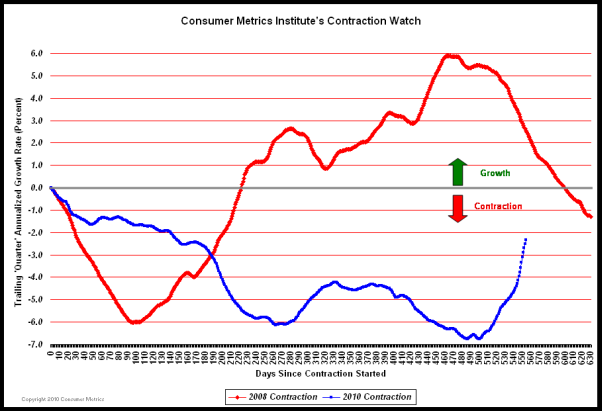
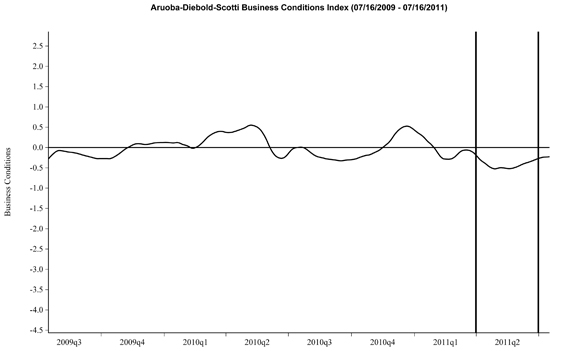
Here is the latest chart, depicting 7-16-09 to 7-16-11:
-
As per the July 21 release, the LEI was at 115.3 and the CEI was at 102.9 in June.
An excerpt from the July 21 Press Release:
Says Ataman Ozyildirim, economist at The Conference Board:
“The U.S. LEI continued to increase in June, but the strengths among the leading indicators have been balanced with the weaknesses in recent months. The Coincident Economic Index, a monthly measure of current economic activity, continued to increase slowly. The leading indicators point to slowly expanding economic activity in the coming months.”
_________
I post various indicators and indices because I believe they should be carefully monitored. However, as those familiar with this blog are aware, I do not necessarily agree with what they depict or imply.
_____
The Special Note summarizes my overall thoughts about our economic situation
SPX at 1336.70 as this post is written
Monday, July 25, 2011
July 21 Gallup Poll On Economic Confidence - Notable Excerpts
On July 21, Gallup released a poll titled "U.S. Economic Confidence Sinks to Lowest Level Since March '09."
A few notable excerpts:
Americans' economic confidence plunged last week to its lowest weekly level since March 2009. Gallup's Economic Confidence Index fell to -41 in the week ending July 17 -- down from -34 the prior week and -31 during the same week a year ago.
also:
U.S. economic confidence has been running below 2010 levels during most of June and July. But the recent plunge sent this year's economic confidence down even further -- back to the recessionary levels of early 2009.
also:
Gallup's Economic Confidence Index combines two measures: one assessing Americans' views about whether the U.S. economy is "getting better" or "getting worse," and the second involving Americans' ratings of current economic conditions as "excellent," "good," "only fair," or "poor." The "getting better" ratings fell and the "getting worse" ratings rose in the week ending July 17 to levels not seen since March 2009.
also:
The percentage of Americans saying the U.S. economy is getting better dropped to 26% last week. This is the lowest level for this measure since March 2009. More than two-thirds of Americans now say the U.S. economy is getting worse -- a two-year high.
_____
The Special Note summarizes my overall thoughts about our economic situation
SPX at 1345.02 as this post is written
Thursday, July 21, 2011
Disturbing Charts (Update 5)
I find the following charts to be disturbing. These charts would be disturbing at any point in the economic cycle; that they depict such a tenuous situation now – 24 months after the official (as per the 9-20-10 NBER announcement) June 2009 end of the recession – is especially notable.
These charts raise a lot of questions. As well, they highlight the “atypical” nature of our economic situation from a long-term historical perspective. I regularly discuss many troubling characteristics of our economy in this EconomicGreenfield.com blog.
All of these charts (except one, as noted) are from The Federal Reserve, and represent the most recently updated data.
These following charts are from the St. Louis Federal Reserve:
(click on charts to enlarge images)
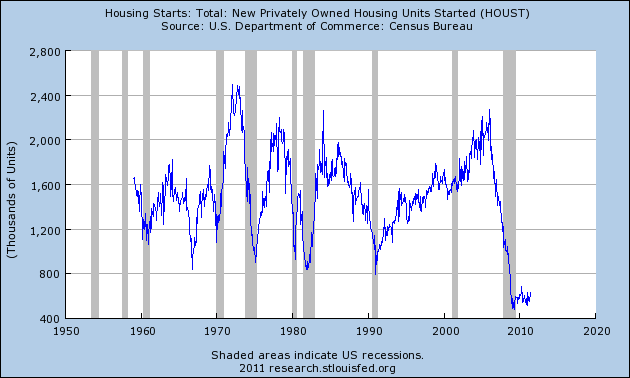
Housing starts (last updated 7-19-11):
-
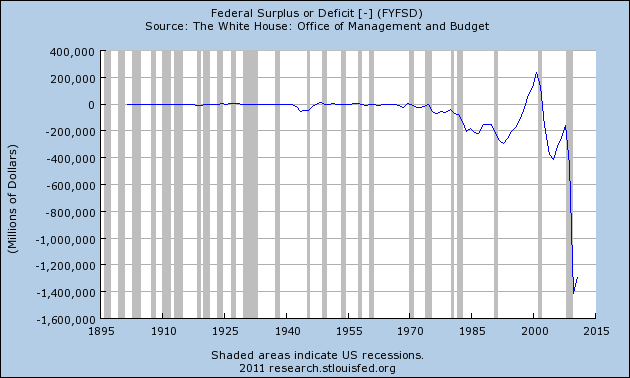
The Federal Deficit (last updated 2-17-11):
-
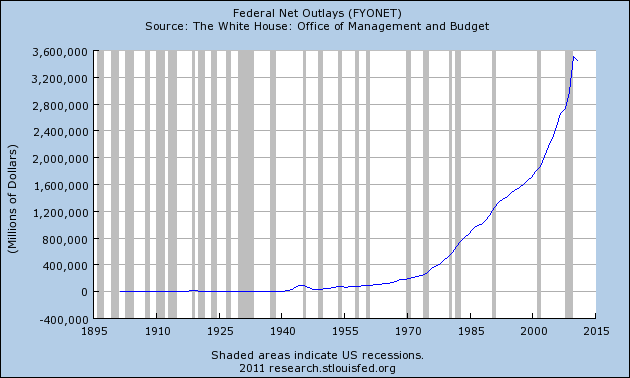
Federal Net Outlays (last updated 2-17-11):
-
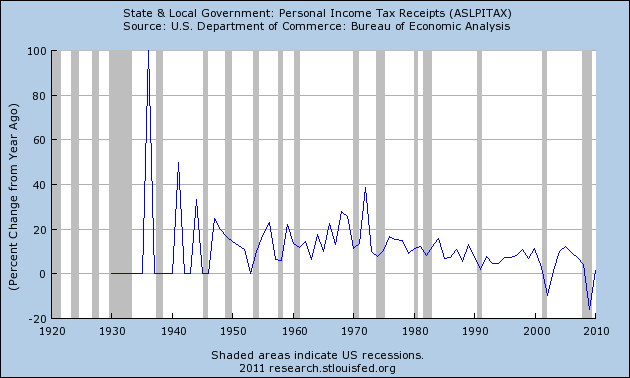
State & Local Personal Income Tax Receipts (% Change from Year Ago)(last updated 3-25-11):
-
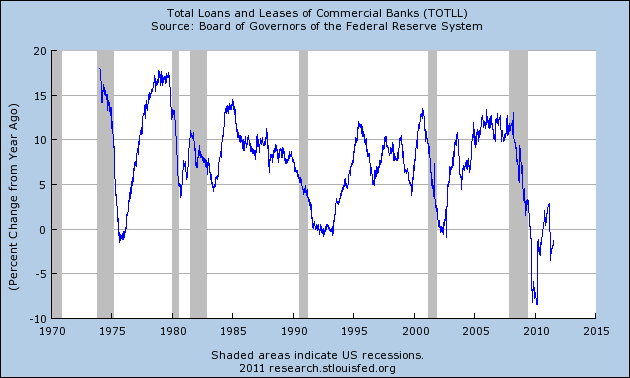
Total Loans and Leases of Commercial Banks (% Change from Year Ago)(last updated 7-18-11):
-
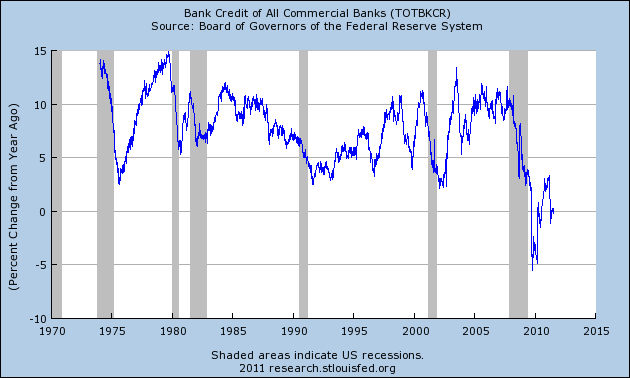
Bank Credit – All Commercial Banks (% Change from Year Ago)(last updated 7-18-11):
-
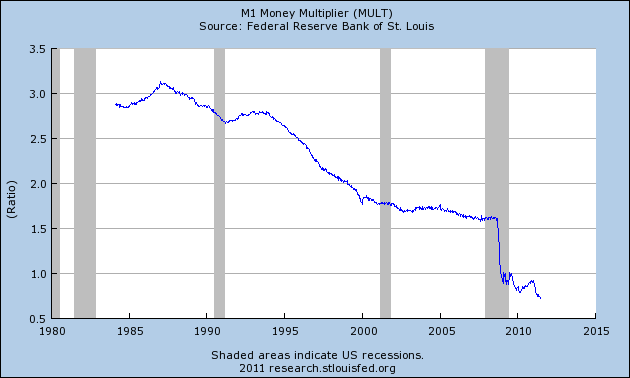
M1 Money Multiplier (last updated 7-14-11):
-
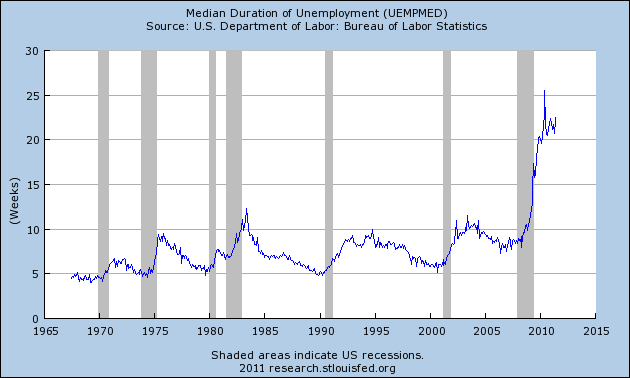
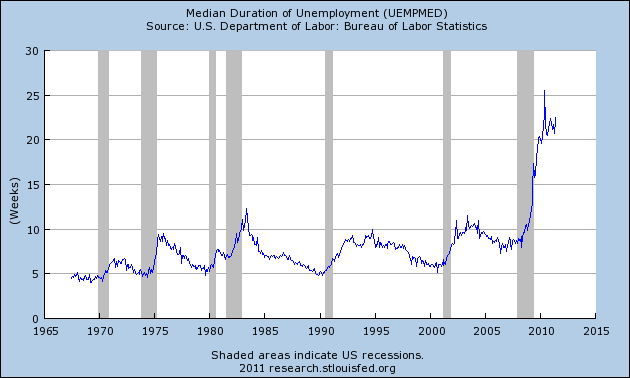
Median Duration of Unemployment (last updated 7-8-11):
-
This next chart is from the CalculatedRisk.com blog post of 7-8-11, titled "titled “Employment Summary, Part Time Workers and Unemployed over 26 Weeks” and it shows (in red) the relative length and depth of this downturn and subsequent recovery from an employment perspective:
-
This last chart is of the Chicago Fed National Activity Index (CFNAI) and it depicts broad-based economic activity (last updated 6-23-11):
-
I will update these charts on an intermittent basis as they deserve close monitoring…
_____
The Special Note summarizes my overall thoughts about our economic situation
SPX at 1325.84 as this post is written
Wednesday, July 20, 2011
Deloitte "CFO Signals" Report 2Q 2011 - Notable Aspects
Recently Deloitte released their "CFO Signals" report (pdf) for 2nd Quarter 2011.
As seen in page 2 of the report, "Seventy-eight CFOs responded during the two weeks ended May 27. Three fourths are from public companies, and three-fourths are from companies with more than $1B in annual revenue."
Here are some excerpts that I found notable:
from page 5:
But something appears to have shifted substantially this quarter with respect to CFOs’ optimism. Despite continuing positive financial expectations, CFOs’ own-company optimism dropped markedly this quarter. The difference between the percentage of CFOs who are more optimistic and those who are less optimistic (or “net optimism”) was 47 percentage points last quarter, and it dropped to just 8 this quarter. Moreover, where past pessimism has been driven largely by deteriorating assessments of the macro-business environment, roughly half of the rising pessimism this quarter is driven by internal concerns.
from page 15, concerning "own-company optimism" :
This quarter, optimism rose at its slowest pace in the past five quarters. Moreover, the spread between those indicating rising optimism and those indicating falling optimism (“net optimism”) fell to just 7.7%—considerably lower than the spreads we have seen in the past year.
from page 17, concerning Industry "top challenges" :
As several domestic markets stagnate, many companies face challenges in their attempts to grow. This quarter nearly 30% of CFOs say market growth is a top challenge, and another 25% cite pressures from market contraction.
Uncertain demand is leading to other repercussions, including rising competition and pricing pressures. Pricing trends are a top concern for 53% of companies and for five of the eight industries (except Energy/Resources, Healthcare/Pharma, and T/M/E). Rising input prices may be exacerbating pricing challenges with nearly one quarter of CFOs naming this a top three challenge, but industry overcapacity and excess inventories do not appear to be major contributors (except within Services, where overcapacity appears to be a growing challenge).
_____
The Special Note summarizes my overall thoughts about our economic situation
SPX at 1326.82 as this post is written
Tuesday, July 19, 2011
The July 2011 Wall Street Journal Economic Forecast Survey
The July Wall Street Journal Economic Forecast Survey was published July 18, 2011. The headline is “Dearth of Demand Seen Behind Weak Hiring.”
I found various aspects of the survey to be interesting, including the following excerpts:
In the survey, conducted July 8-13 and released Monday, 53 economists—not all of whom answer every question—were asked the main reason employers aren't hiring more readily. Of the 51 who responded to the question, 31 cited lack of demand (65%) and 14 (27%) cited uncertainty about government policy. The others said hiring overseas was more appealing.
also:
"We're hiring a little here and there—but it's not what it should be," said Daniel Cunningham, chief executive of Long-Stanton Manufacturing Co., of Hamilton, Ohio. "And it's because of the lack of demand." Long-Stanton, which makes metal parts for the aerospace, medical and other industries, has snapped back from the recession, "but volume is still not up to where it was, or where it should be," Mr. Cunningham said. Long-Stanton is privately held and has 75 employees.
Mr. Cunningham said part of what makes him hesitant is the extreme volatility he sees—with business up one month, then down the next. "Instead of good years, it's like you have a good month—or a good three months," he says, adding that this makes it difficult for him to feel confident of steady demand.
In the Q&A section (spreadsheet detail) there is an interesting question about bubbles. Here is the question and responses:
Please estimate on a scale of 0 to 100 the probability that there is a bubble in the following markets:
Property prices in China 64%
Gold 61%
U.S. Internet stocks 48%
U.S. Treasury Bonds 44%
Leveraged Loans 34%
Equities Generally 24%
The current average forecasts among economists polled include the following:
GDP:
full-year 2011 : 2.6%
full-year 2012: 3.0%
Unemployment Rate:
December 2011: 8.8%
December 2012: 8.1%
10-Year Treasury Yield:
December 2011: 3.55%
December 2012: 4.24%
CPI:
December 2011: 3.1%
December 2012: 2.4%
Crude Oil ($ per bbl):
for 12/31/2011: $95.59
for 12/31/2012: $98.69
(note: I comment upon this survey each month; commentary on past surveys can be found under the “Economic Forecasts” tag)
_____
I post various economic forecasts because I believe they should be carefully monitored. However, as those familiar with this blog are aware, I do not necessarily agree with many of the consensus estimates and much of the commentary in these forecast surveys.
_____
The Special Note summarizes my overall thoughts about our economic situation
SPX at 1301.03 as this post is written
Monday, July 18, 2011
NFIB Small Business Optimism – June 2011
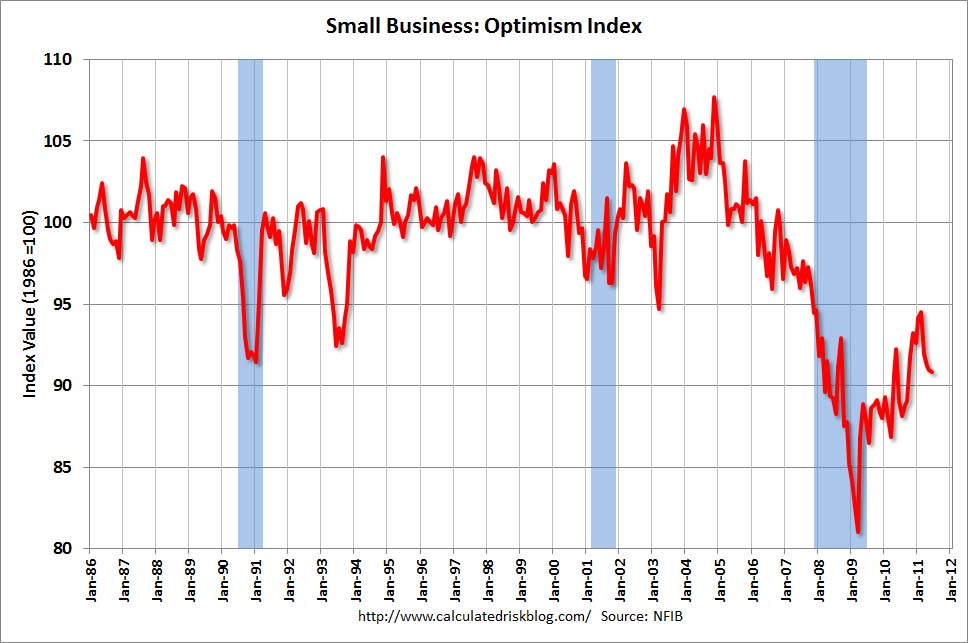
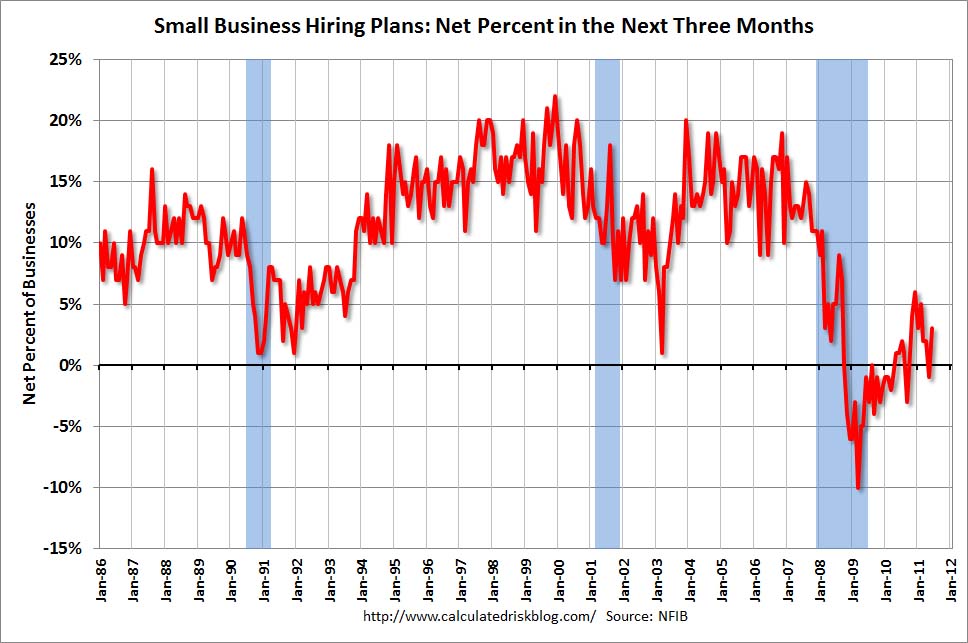
The June NFIB Small Business Optimism was released July 12. The headline of the Press Release is “Small Business Optimism Stagnates: Main Street Desperately in Search of Reasons to be Positive.”
The Index of Small Business Optimism declined .1 points in June, falling to 90.8.
Here are some excerpts from the report that I find particularly notable:
Earnings trends for small businesses remained distressingly negative in June, particularly given that the recovery is now beginning its third year. According to today’s report, 69 percent of the owners view the current period as a poor time to expand and 75 percent of those blame the weak economy for their outlook, while 10 percent cite political uncertainty.
also:
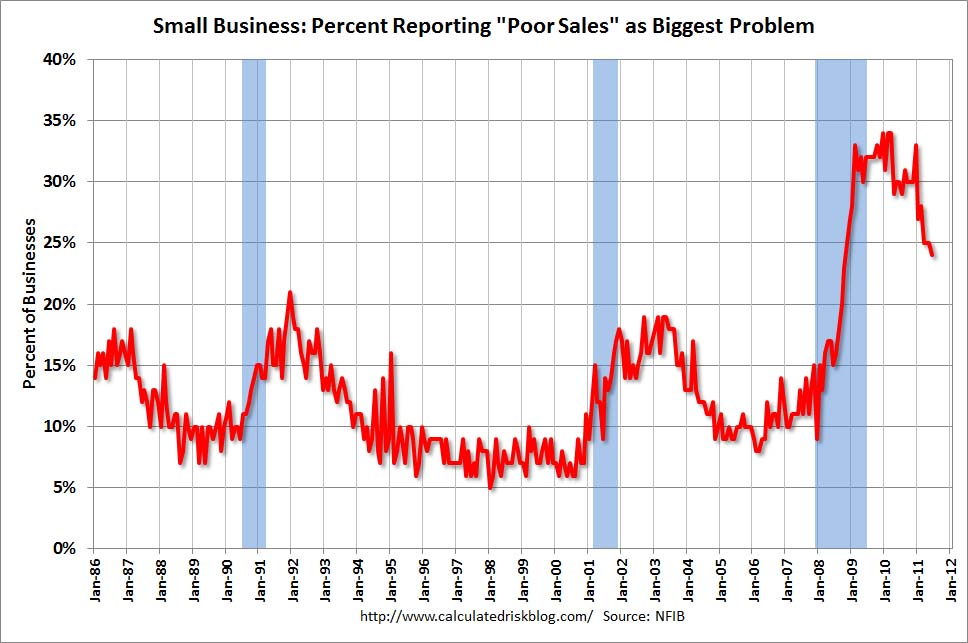
The sales outlook for small firms continues to look grim as expectations have declined for 4 months in a row and “poor sales” continues to be the #1 problem for owners in operating their business. The net percent of owners expecting higher real sales fell 3 points to a net 0 percent of all owners (seasonally adjusted), 13 points below January’s reading. The net percent of all owners (seasonally adjusted) reporting higher nominal sales over the past 3 months improved 2 percentage points, rising to a net negative 7 percent, more firms with sales trending down than up.
also:
Access to credit remains a limited problem as it continues to affect a small percentage of owners. Three percent of owners reported financing as their #1 business problem and 91 percent reported that all their credit needs were met or that they were not interested in borrowing.
In conjunction with this June NFIB Small Business Optimism Survey, the CalculatedRisk blog on July 12 (in a post titled "NFIB: Small Business Optimism Index 'basically unchanged' in June") had three charts that depicted various facets (the Index itself; Hiring Plans and Poor Sales) of the Survey, as shown below:
(click on charts to enlarge images)
_____
The Special Note summarizes my overall thoughts about our economic situation
SPX at 1316.14 as this post is written
Friday, July 15, 2011
Conference Board CEO Confidence 2Q 2011
On June 20, I wrote a post about the latest Business Roundtable’s CEO Economic Outlook Survey and the Duke/CFO Magazine Global Business Outlook Survey titled "CEO & CFO Surveys 2Q 2011."
Subsequent to that post, on July 8, the Conference Board released its 2nd Quarter CEO Confidence Survey. The overall measure of CEO Confidence was at 55, down from 67 in the first quarter.
Notable excerpts from the July 8 Press Release include:
CEOs’ assessment of current economic conditions was much more pessimistic than last quarter. Only 33 percent say conditions are better compared to six months ago, down from 85 percent last quarter. In assessing their own industries, business leaders were also more negative. Now, just 40 percent say conditions have improved, compared with 61 percent in the first quarter.
CEOs’ optimism about the short-term outlook also declined sharply. Currently, only 43 percent foresee an improvement in economic conditions over the next six months, down from 66 percent last quarter. Expectations for their own industries are about as pessimistic, with just 44 percent of CEOs expecting conditions to improve in the months ahead, down from 49 percent last quarter.
_____
I post various economic forecasts because I believe they should be carefully monitored. However, as those familiar with this blog are aware, I do not agree with many of the consensus estimates and much of the commentary in these forecast surveys.
_____
The Special Note summarizes my overall thoughts about our economic situation
SPX at 1308.87 as this post is written
Thursday, July 14, 2011
Ben Bernanke's Prepared Testimony July 13 - Notable Excerpts
Yesterday Ben Bernanke gave his testimony before the Committee on Financial Services as part of the Semiannual Monetary Policy Report to the Congress.
His prepared testimony didn't seem to contain content significantly different from that he has previously stated.
However, in my opinion, his prepared testimony does serve as a convenient collection of various of his current thoughts and analyses.
While I don't agree with various of the following excerpts, I do find them notable:
(note - these excerpts are in the order they appear in the prepared testimony)
In part, the recent weaker-than-expected economic performance appears to have been the result of several factors that are likely to be temporary.
-
In light of these developments, the most recent projections by members of the Federal Reserve Board and presidents of the Federal Reserve Banks, prepared in conjunction with the Federal Open Market Committee (FOMC) meeting in late June, reflected their assessment that the pace of the economic recovery will pick up in coming quarters. Specifically, participants' projections for the increase in real GDP have a central tendency of 2.7 to 2.9 percent for 2011, inclusive of the weak first half, and 3.3 to 3.7 percent in 2012--projections that, if realized, would constitute a notably better performance than we have seen so far this year.1
-
Long-term unemployment imposes severe economic hardships on the unemployed and their families, and, by leading to an erosion of skills of those without work, it both impairs their lifetime employment prospects and reduces the productive potential of our economy as a whole.
-
... many potential homebuyers remain concerned about buying into a falling market, as weak demand for homes, the substantial backlog of vacant properties for sale, and the high proportion of distressed sales are keeping downward pressure on house prices.
-
The Federal Reserve's acquisition of longer-term Treasury securities boosted the prices of such securities and caused longer-term Treasury yields to be lower than they would have been otherwise. In addition, by removing substantial quantities of longer-term Treasury securities from the market, the Fed's purchases induced private investors to acquire other assets that serve as substitutes for Treasury securities in the financial marketplace, such as corporate bonds and mortgage-backed securities. By this means, the Fed's asset purchase program--like more conventional monetary policy--has served to reduce the yields and increase the prices of those other assets as well. The net result of these actions is lower borrowing costs and easier financial conditions throughout the economy.2 We know from many decades of experience with monetary policy that, when the economy is operating below its potential, easier financial conditions tend to promote more rapid economic growth. Estimates based on a number of recent studies as well as Federal Reserve analyses suggest that, all else being equal, the second round of asset purchases probably lowered longer-term interest rates approximately 10 to 30 basis points.3 Our analysis further indicates that a reduction in longer-term interest rates of this magnitude would be roughly equivalent in terms of its effect on the economy to a 40 to 120 basis point reduction in the federal funds rate.
-
When we began this program, we certainly did not expect it to be a panacea for the country's economic problems. However, as the expansion weakened last summer, developments with respect to both components of our dual mandate implied that additional monetary accommodation was needed. In that context, we believed that the program would both help reduce the risk of deflation that had emerged and provide a needed boost to faltering economic activity and job creation. The experience to date with the round of securities purchases that just ended suggests that the program had the intended effects of reducing the risk of deflation and shoring up economic activity. In the months following the August announcement of our policy of reinvesting maturing and redeemed securities and our signal that we were considering more purchases, inflation compensation as measured in the market for inflation-indexed securities rose from low to more normal levels, suggesting that the perceived risks of deflation had receded markedly. This was a significant achievement, as we know from the Japanese experience that protracted deflation can be quite costly in terms of weaker economic growth.
-
Once the temporary shocks that have been holding down economic activity pass, we expect to again see the effects of policy accommodation reflected in stronger economic activity and job creation. However, given the range of uncertainties about the strength of the recovery and prospects for inflation over the medium term, the Federal Reserve remains prepared to respond should economic developments indicate that an adjustment in the stance of monetary policy would be appropriate.
On the one hand, the possibility remains that the recent economic weakness may prove more persistent than expected and that deflationary risks might reemerge, implying a need for additional policy support. Even with the federal funds rate close to zero, we have a number of ways in which we could act to ease financial conditions further. One option would be to provide more explicit guidance about the period over which the federal funds rate and the balance sheet would remain at their current levels. Another approach would be to initiate more securities purchases or to increase the average maturity of our holdings. The Federal Reserve could also reduce the 25 basis point rate of interest it pays to banks on their reserves, thereby putting downward pressure on short-term rates more generally. Of course, our experience with these policies remains relatively limited, and employing them would entail potential risks and costs. However, prudent planning requires that we evaluate the efficacy of these and other potential alternatives for deploying additional stimulus if conditions warrant.
-
The full Monetary Policy Report to the Congress (pdf) contains a variety of commentary and analyses as well as detailed economic forecasts.
_____
The Special Note summarizes my overall thoughts about our economic situation
SPX at 1317.72 as this post is written
Wednesday, July 13, 2011
Financial Stocks - Relative Price To Overall Stock Market
In the June 29 post ("Financial Stocks - Notable Price Action") I wrote the following:
I think that the relatively poor “price action” of various financial stocks is notable. It is one of many current indications that overall stock market health is not as strong as a casual glance at the major indices would indicate.
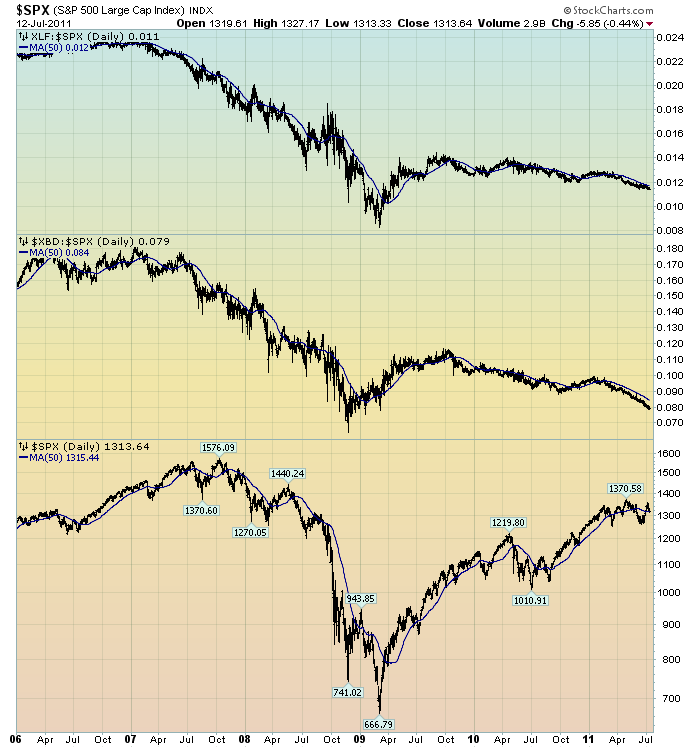
I continue to believe that the lagging / "sagging" price of various financial stocks is highly notable. Here is another chart that I created a while ago that provides another view of the poor "price action" of the financial stocks vs. that of the entire stock market, as depicted by the S&P500:
(click on chart to enlarge image)(chart courtesy of StockCharts.com; chart created by and annotated by author)
-
The above chart is depicted on a daily basis, LOG scale, since 2006. On each of the three plots, a blue line depicts the 50dma for perspective.
As one can see, there has been an interesting progression of the relative price of the XLF (Financial SPDR) vs. the S&P500, as seen in the top of the chart. In the middle of the chart, the same can be seen in the $XBD (Broker/Dealer Index). Generally, since mid-2009, the price of both the XLF and $XBD have been on a slow downward trajectory relative to the price of the S&P500, which is plotted on the bottom of the chart.
In my experience, any time the financials lag the general stock market for a considerable period, it is generally a "red flag" that should be closely monitored.
_____
The Special Note summarizes my overall thoughts about our economic situation
SPX at 1313.64 as this post is written
Monday, July 11, 2011
3 Critical Unemployment Charts - July 2011
As I have commented previously, as in the October 6, 2009 post, in my opinion the official methodologies used to measure the various job loss and unemployment statistics do not provide an accurate depiction; they serve to understate the severity of unemployment.
However, even if one chooses to look at the official statistics, the following charts provide an interesting (and disconcerting) long-term perspective of certain aspects of the officially-stated unemployment situation.
The first two charts are from the St. Louis Fed site. Here is the Median Duration of Unemployment:
(click on charts to enlarge images)(charts updated as of 7-8-11)
-
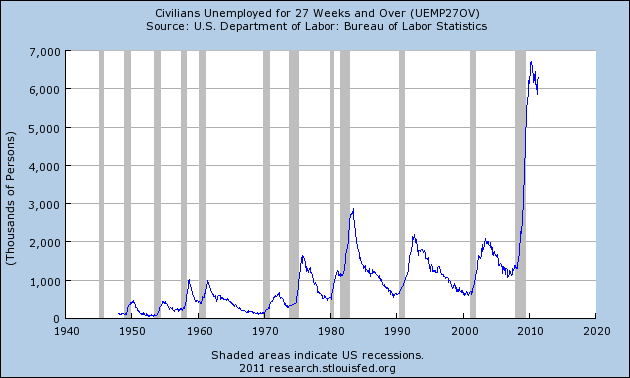
Here is the chart for Unemployed 27 Weeks and Over:
-
Lastly, a chart from the CalculatedRisk.com site, from the July 8 post titled “Employment Summary, Part Time Workers and Unemployed over 26 Weeks.” This shows the employment situation vs. that of previous recessions, as shown:
-
As depicted by these charts, our unemployment problem is severe. Unfortunately, there do not appear to be any “easy” solutions.
In July 2009 I wrote a series of five blog posts titled “Why Aren’t Companies Hiring?”, which discusses various aspects of the topic, many of which lack recognition.
_____
The Special Note summarizes my overall thoughts about our economic situation
SPX at 1343.80 as this post is written
Friday, July 8, 2011
The Crash of 1929 And Its Aftermath
For a variety of reasons I believe that an understanding of the Great Depression and its causes are important. The stock market Crash of 1929 and the events leading up to it are particularly noteworthy.
Along those lines, I have always found the American Experience documentary titled "The Crash of 1929" to be of great interest. Although it is less than an hour long, it does a great job of not only explaining various aspects of what happened in 1929, but also provides a tangible "feel" of the "atmosphere" surrounding the period.
There is much that is noteworthy in the documentary.
The Crash of 1929 serves as a reminder of how devastating epic "crashes" - and their aftermaths - can be.
_____
The Special Note summarizes my overall thoughts about our economic situation
SPX at 1353.22 as this post is written
Thursday, July 7, 2011
Evaluating QE2
On June 30 The Wall Street Journal published a chart titled "QE2: A Quantitative Assessment." It commented on QE2 and showed how various economic and market metrics fared over the course of the program.
The question of QE2's impact is an important one, for a variety of reasons. This impact is especially important as I believe that QE3 or something very similar will be done in the future.
How should the impact(s) of QE2 be assessed?
I believe that such an assessment should be broader than what is commonly seen.
Among areas that should be assessed are the risks taken by performing QE2. I have written extensively about various QE2 risks in previous posts.
Another issue that deserves greater recognition is that pertaining to the risks accompanying the "exit" from QE2. Until such an exit is orchestrated, I don't believe that QE2 can begin to be fully assessed. I wrote about the risks of exit from QE2 in the December 17 post titled "Quantitative Easing Exit Issues."
Overall, I believe that QE2 has had a complex impact on the economy and markets.
_____
The Special Note summarizes my overall thoughts about our economic situation
SPX at 1339.22 as this post is written
Subscribe to:
Posts (Atom)
