In the February 7 ("The VIX Level Of 20 And Its Continual Significance") as well as the February 6 ("Notable Technical And Sentiment Extremes In The Stock Market") posts I discussed various notable aspects of the stock market, ones that I viewed as problematic and worrisome.
In this post, I would like to provide an update on two of those aspects. First, at yesterday's close, the VIX was at 15.64. As I discussed in the aforementioned February 7 post:
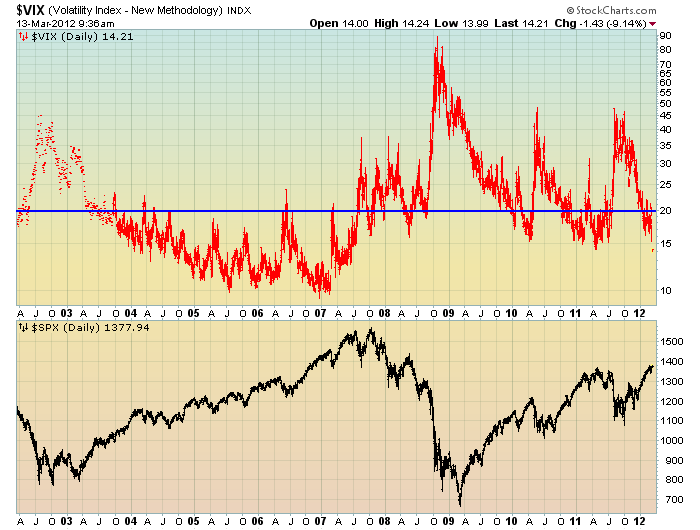
In addition, when one views the VIX compared to the stock market (S&P500) over the last few years, one might conclude that a VIX level under 20 signifies investor overconfidence and/or complacency, as the stock market has often reacted in a sharply negative manner after sustained VIX advances above the 20 level.
Below is a chart displaying the VIX, in red, on a LOG scale, 10-year daily basis through this morning's current level of 14.21. Below the VIX is the S&P500 :
(click on chart to enlarge image)(chart courtesy of StockCharts.com; chart creation and annotation by the author)
-
In addition, the price levels of the VIX vs. the VIX futures is highly notable. I discussed this aspect in the aforementioned February 6 post.
At this moment, with the S&P500 at 1378.11, the VIX is at 14.32, while some VIX futures are at the following levels:
March VIX futures = 17.40
April VIX futures= 21.55
May VIX futures = 23.60
June VIX futures =24.85
August futures = 26.95
September futures =27.70
I view this spread as being highly outsized and is one of many “red flags” in the market.
_____
The Special Note summarizes my overall thoughts about our economic situation
SPX at 1378.11 as this post is written

No comments:
Post a Comment