Here is an update on various indicators that are supposed to predict and/or depict economic activity. These indicators have been discussed in previous blog posts:
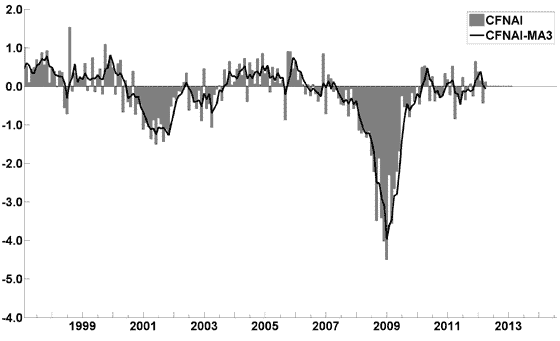
The May Chicago Fed National Activity Index (CFNAI)(pdf) updated as of May 21, 2012:
-
An excerpt from the April 26 update titled “Index forecasts weaker growth” :
The April update of the USA TODAY/IHS Global Insight Economic Outlook Index shows real GDP growth, at a six-month annualized growth rate, increasing to 2.5% in February and March and then slowing to 2.0% during the summer months. While employment, housing (mostly the multifamily sector) and consumer spending are slowly recovering, concerns about the Eurozone and world growth continue.
-
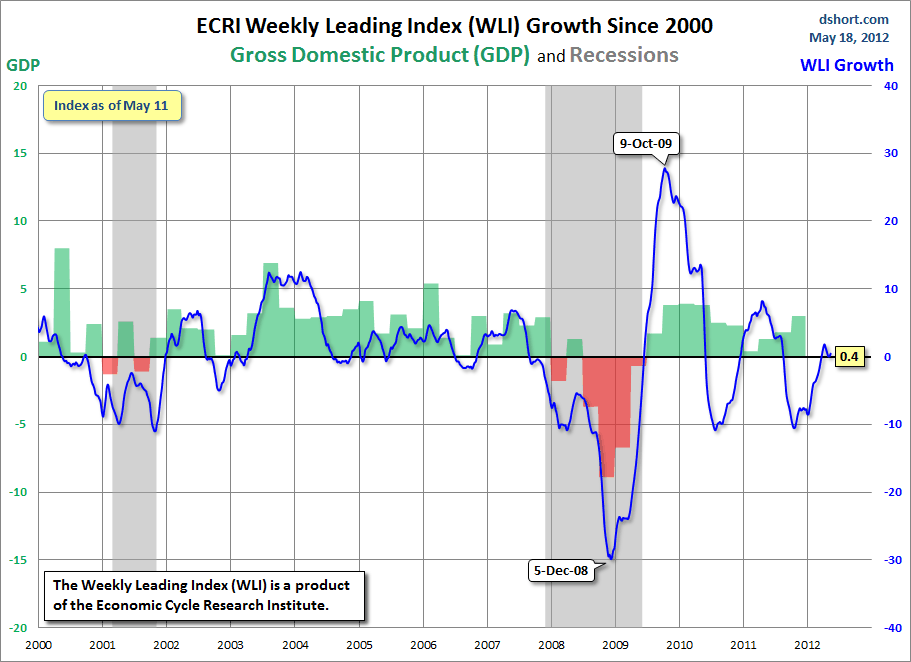
As of 5/18/12 (incorporating data through 5/11/12) the WLI was at 124.5 and the WLI, Gr. was at .4%.
A chart of the WLI, Gr. since 2000, from Doug Short’s blog of May 18 titled “ECRI Recession Call Update: WLI Declines, But Growth Improves Slightly” :
-
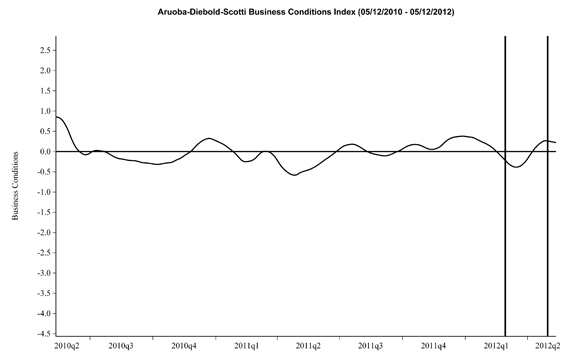
Here is the latest chart, depicting 5-12-10 to 5-12-12:
-
As per the May 17 release, the LEI was at 95.5 and the CEI was at 104.3 in April.
An excerpt from the May 17 release:
Says Ataman Ozyildirim, economist at The Conference Board: “The LEI declined slightly in April. Falling housing permits, rising initial claims for unemployment insurance and subdued consumer expectations offset small gains in the remaining components. The LEI’s six-month growth rate fell slightly, but remains in expansionary territory and well above its growth at the end of 2011. The CEI, a measure of current economic conditions, has also increased for five consecutive months.”
_________
I post various indicators and indices because I believe they should be carefully monitored. However, as those familiar with this blog are aware, I do not necessarily agree with what they depict or imply.
_____
The Special Note summarizes my overall thoughts about our economic situation
SPX at 1317.73 as this post is written


No comments:
Post a Comment