Here is an update on various indicators that are supposed to predict and/or depict economic activity. These indicators have been discussed in previous blog posts:
The February Chicago Fed National Activity Index (CFNAI)(pdf) updated as of February 25, 2013:

-
As of 2/22/13 (incorporating data through 2/15/13) the WLI was at 129.1 and the WLI, Gr. was at 7.6%.
A chart of the WLI, Gr. since 2000, from Doug Short’s blog of February 22 titled “ECRI 'Recession' Update: Proprietary Indicators Slip Again” :

-
Here is the latest chart, depicting 2-16-11 to 2-16-13:
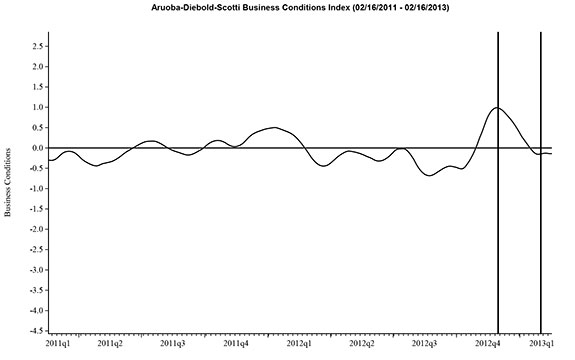
-
As per the February 21 press release, the LEI was at 94.1 and the CEI was at 106.5 in January.
An excerpt from the February release:
Says Ken Goldstein, economist at The Conference Board: “The indicators point to an underlying economy that remains relatively sound but sluggish. Credit use has picked up, driven in part by relatively strong demand for auto loans. The biggest positive factor is housing. The housing market is now at twice the level reached during its recessionary lows, and will likely continue to improve through the spring, delivering some growth momentum to the labor market and the overall economy. The biggest risk, however, is the adverse impact of cuts in federal spending.”
Here is a chart of the LEI from Doug Short’s blog post of February 21 titled “Conference Board Leading Economic Index: 'Slow But Continued Expansion'" :
_________
I post various indicators and indices because I believe they should be carefully monitored. However, as those familiar with this blog are aware, I do not necessarily agree with what they depict or imply.
_____
The Special Note summarizes my overall thoughts about our economic situation
SPX at 1487.85 as this post is written
No comments:
Post a Comment