Stocks have continued to perform (very) strongly since the November elections, and various indices have achieved a series of record-high closes since that time.
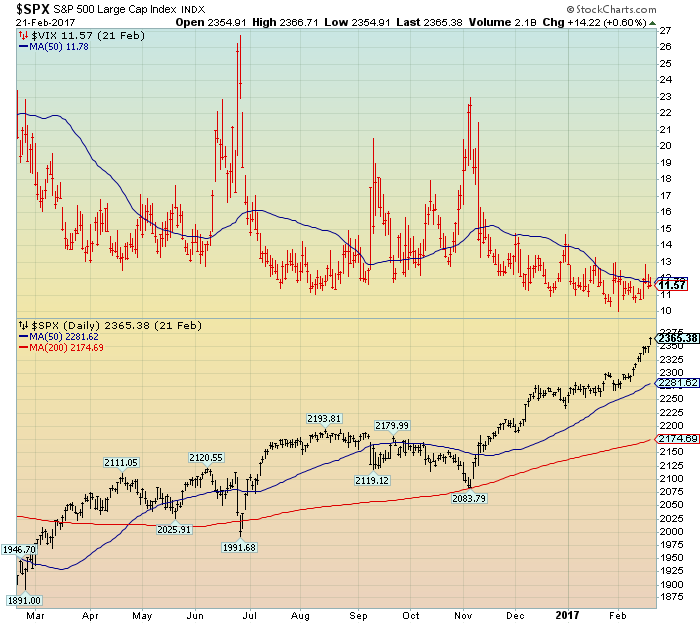
For reference purposes, below is a 1-year chart of the S&P500 and VIX through Tuesday’s (February 21, 2017) close. The closing price for the S&P500 was 2365.38 and the VIX had a closing value of 11.57. Price labels as well as moving averages are also shown:
(click on chart to enlarge image)(chart courtesy of StockCharts.com; chart creation and annotation by the author)
_____
The Special Note summarizes my overall thoughts about our economic situation
SPX at 2361.44 as this post is written
No comments:
Post a Comment