Throughout this site there are many charts of economic indicators. At this time, the readings of various indicators are especially notable. While many are still indicating economic growth, others depict (or imply) various degrees of weakness.
Below are a small sampling of charts that depict greater degrees of weakness and/or other worrisome trends, and a brief comment for each:
Consumer Spending
In the March 23, 2017 post ("'Hidden' Weakness In Consumer Spending?") I wrote of various indications that consumer spending may be (substantially) less than what is depicted by various mainstream indicators. There are widespread consequences for the U.S. economy, including the implications regarding the substantial number of retail store closures.
Auto Sales
One aspect of consumer spending, auto sales, have experienced significant growth over the post-2009 period, and the current reading (through March) is 16.529 million vehicles:
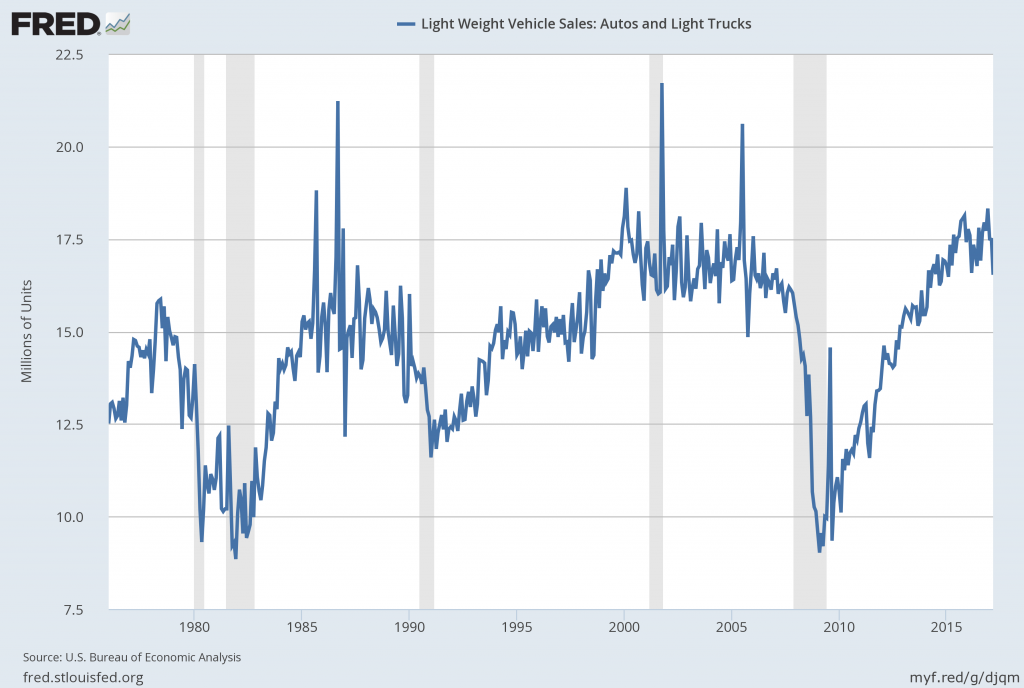
source: U.S. Bureau of Economic Analysis, Light Weight Vehicle Sales: Autos and Light Trucks [ALTSALES], retrieved from FRED, Federal Reserve Bank of St. Louis; accessed April 10, 2017:
While some believe that auto sales have peaked, what is more worrisome is various underlying dynamics of these sales. While an exhaustive discussion of such dynamics would be exceedingly lengthy, various notable factors include the degree to which (ultra-) cheap financing and relaxed financing terms are aiding sales, as well as the current amount of discounting and various new- and used-car inventory levels. In essence, the current business model for the entire automotive industry appears vulnerable, with wide-ranging, substantial economic implications.
Heavy Truck Sales
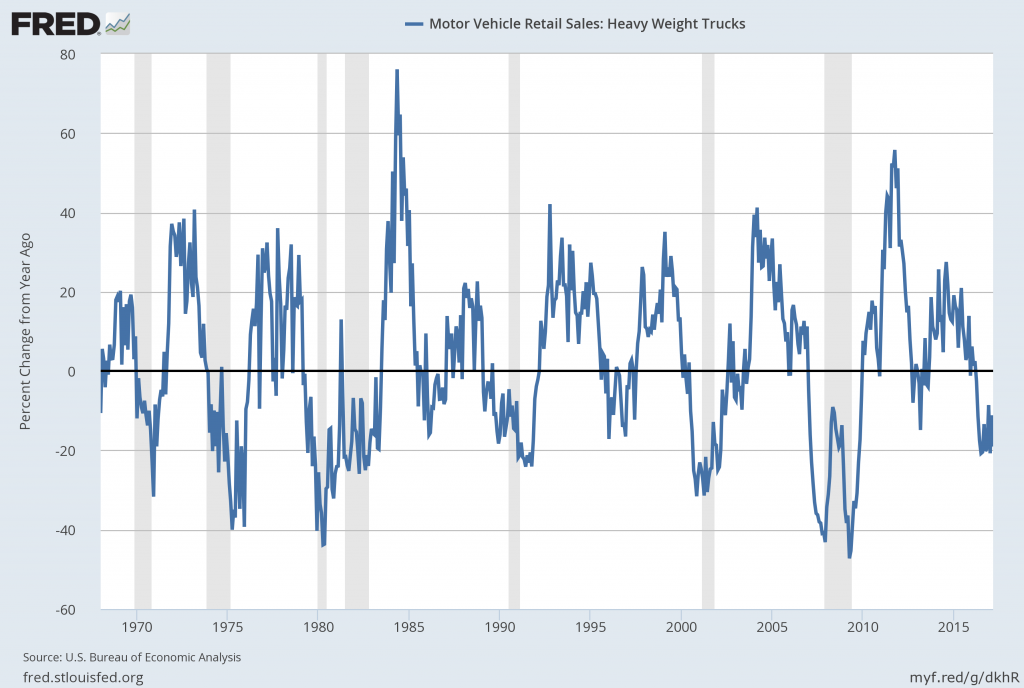
Another area of vehicle sales which continues to indicate disconcerting trends is sales of Heavy Trucks, defined as trucks with more than 14,000 pounds gross vehicle weight. Below is a chart of the sales trend since 1968, with a value of .366 million SAAR through March 2017 as of the April 10 update:
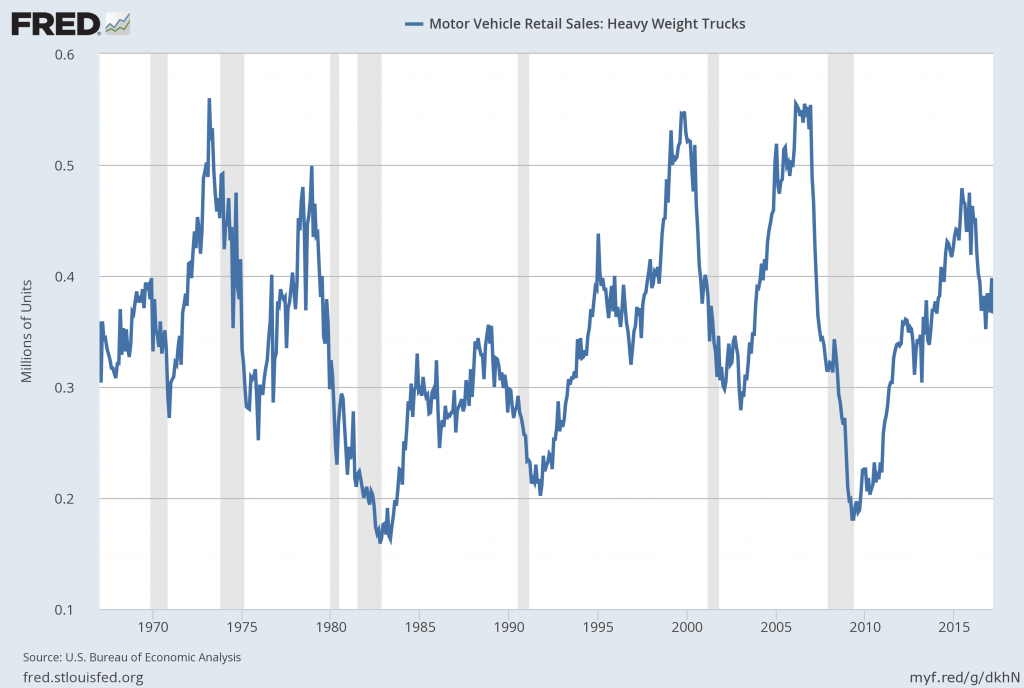
source: U.S. Bureau of Economic Analysis, Motor Vehicle Retail Sales: Heavy Weight Trucks [HTRUCKSSAAR], retrieved from FRED, Federal Reserve Bank of St. Louis, accessed April 10, 2017:
A chart depicting this measure on a "Percent Change From Year Ago" basis:
GDP Estimates
While there are many GDP forecasts indicating GDP growth exceeding 2% for 2017, the first quarter GDP estimate provided by the Federal Reserve Bank of Atlanta “GDP Now” is distinctly different than the consensus. As of the April 7, 2017 update, the estimate for the 1st Quarter of 2017 is .6%.
What is notable in this estimate is the persistent and significant degree of decline.
While I don't believe in putting undue emphasis on one estimate, it does serve as yet another indication that economic activity may be (substantially) below the consensus estimates.
"Reflation"
One aspect of the U.S. economy that has been widely discussed since the November 2016 elections is that of "reflation."
While, on an aggregate basis, some "reflation" appears to have recently occurred, it appears to be muted in nature. In addition, various factors indicate that such "reflation" will be transitory in nature.
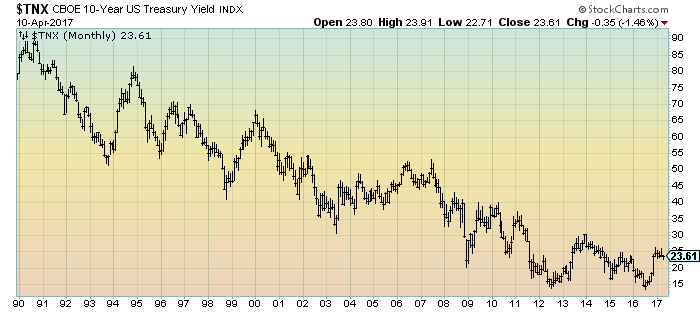
Indications of the above are various, and include the persistently subdued 10-Year Treasury Yield (at 2.361% as of the April 10 close) and the levels seen in the yield curve.
Here is a chart of the 10-Year Treasury Yield, from 1990:
(click on chart to enlarge image)(chart courtesy of StockCharts.com; chart creation and annotation by the author)
The level of current inflation and the possibility of deflation (when the CPI goes below zero) is a vastly complex topic, and as such isn’t suitably discussed in a brief manner. I have discussed the issue of deflation extensively as I continue to believe that outright sustained deflation will occur. As I have stated in past commentaries, I don’t believe that surveys or “market-based” measures concerning deflation will provide adequate “advance warning” of impending deflation.
Other Indicators
As well, many other indicators – including vastly problematical conditions in current and especially future employment - and other areas mentioned on this site indicate economic weakness if not outright (substantially) problematical economic conditions.
_____
The Special Note summarizes my overall thoughts about our economic situation
SPX at 2353.78 as this post is written
No comments:
Post a Comment