The subject of deflation contains many complex aspects, and accordingly no short discussion can even begin to be a comprehensive discussion of such. For reference, my past posts concerning U.S. deflation can be found under the "deflation" label.
In this post I would like to highlight some recent notable developments.
Trying to assess and/or predict the possibility of U.S. deflation is very challenging for many reasons. Among these reasons is that there are many different measures that are supposed to predict and/or depict the possibility of deflation, and they can show apparently contradictory readings. Among these measures are both survey-based as well as market-based measures.
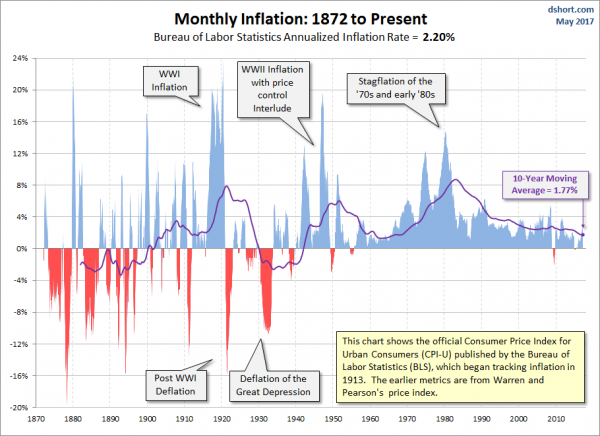
Another challenge is that deflation in the U.S. has been relatively non-existent since the beginning of the 20th Century. As such, knowledge and “practical experience” with deflation is lacking. As seen in the below chart (from Doug Short’s May 15, 2017 post titled “A Long-Term Look at Inflation“) with the exception of The Great Depression prolonged periods of pronounced deflation have practically been nonexistent, especially after 1950:
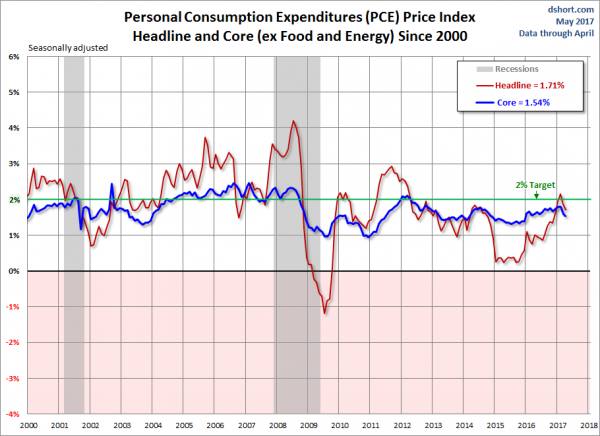
Of note, the shortfall between the Federal Reserve’s stated inflation target (2% on the PCE Price Index) and the actual inflation reading continues. For years there has been a continued inability for the 2% inflation target to be sustained. For reference, here is a chart of the PCE Price Index from Doug Short’s post of May 30, 2017, titled “PCE Price Index Headline and Core Down Again in April“:
There are many reasons that I believe that U.S. deflation of a pronounced and lasting nature will occur. Among the reasons for such are the following:
- As mentioned above, the continuing inability to “create” inflation to rise above the 2% goal.
- Prolonged and pronounced economic low- and no-growth levels experienced globally. While there is widespread consensus that U.S. economic growth will remain positive for the foreseeable future, my analyses indicates that the economy continues to have many highly problematical areas and that the widespread consensus concerning current and future economic growth is (substantially) incorrect.
- A renewed “flattening” of the Yield Curve. While, for many reasons, I believe that the "Yield Curve" and its various proxies have to viewed with caution, the current trends are notable. Below is a chart of a yield curve proxy, showing the spread between the 10-Year Treasury and 2-Year Treasury, using constant maturity securities. This daily chart is from June 1, 1976 through June 8, 2017, with recessionary periods shown in gray. The current value is .86%:
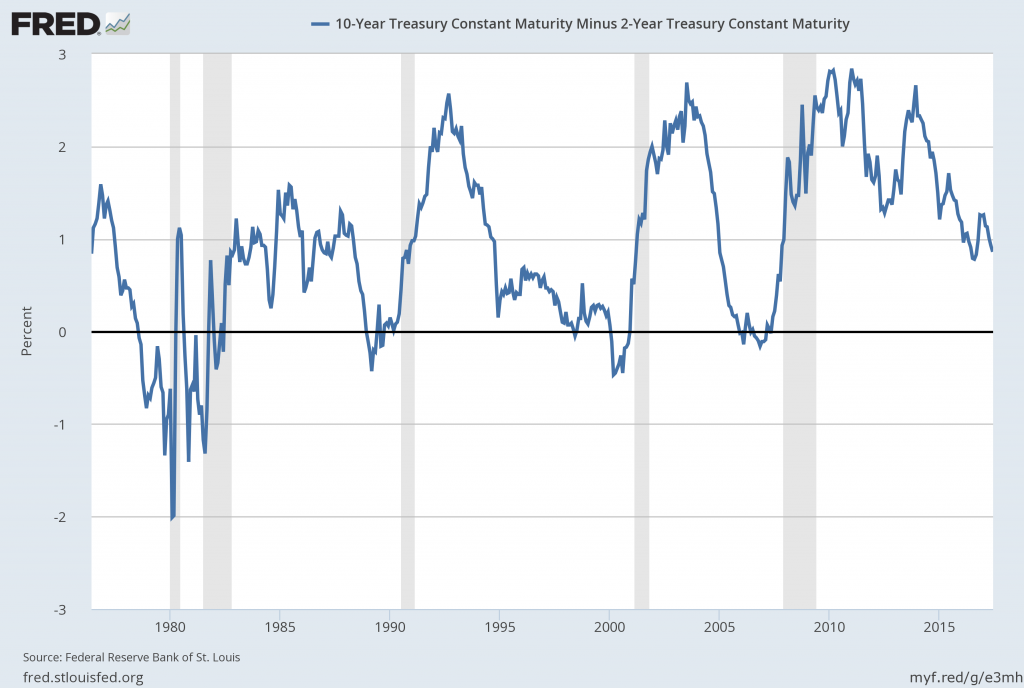
source: Federal Reserve Bank of St. Louis, 10-Year Treasury Constant Maturity Minus 2-Year Treasury Constant Maturity [T10Y2Y], retrieved from FRED, Federal Reserve Bank of St. Louis; accessed June 12, 2017: https://research.stlouisfed.org/fred2/series/T10Y2Y
- Continual indications of “deflationary pressures.” I have written extensively concerning these persistent “deflationary pressures,” which have manifested in a variety of areas.
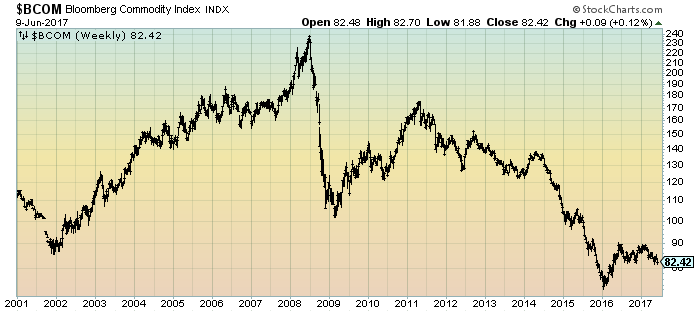
- I continue to believe that the many continuing signs of “deflationary pressures” is a foreboding. Among these signs is the pronounced weakness in many commodities. One such measure is the Bloomberg Commodity Index, as seen below: (chart courtesy of StockCharts.com; chart creation and annotation by the author)
In conclusion, I continue to believe that significant (in extent and duration) U.S. deflation is on the horizon. As discussed in the November 14, 2013 post (“Thoughts Concerning Deflation”), deflation often accompanies financial system distress. My analyses continue to show an exceedingly complex future financial condition in which an exceedingly large “financial system crash” will occur, during and after which outright deflation will both accompany and exacerbate economic and financial conditions.
_____
The Special Note summarizes my overall thoughts about our economic situation
SPX at 2440.35 as this post is written
No comments:
Post a Comment