Throughout this site there are many discussions of economic indicators. At this time, the readings of various indicators are especially notable.
While many U.S. economic indicators – including GDP – are indicating economic growth, others depict (or imply) various degrees of weak growth or economic contraction.
Below are a small sampling of charts that depict greater degrees of weakness and/or other worrisome trends, and a brief comment for each:
Overall Economic Activity
While the recently-released 2nd quarter GDP figure (Second Estimate) was 3.0%, there are other broad-based economic indicators that seem to imply a weaker growth rate. As well, it should be remembered that GDP figures can be substantially revised.
Among the broad-based economic indicators that imply weaker growth is that of the Chicago Fed National Activity Index (CFNAI) and the Aruoba-Diebold-Scotti Business Conditions Index (ADS Index), both featured in the August 17, 2017 post titled “Broad-Based Indicators Of Economic Activity.” Below is a chart of the CFNAI, as of August 21, 2017:
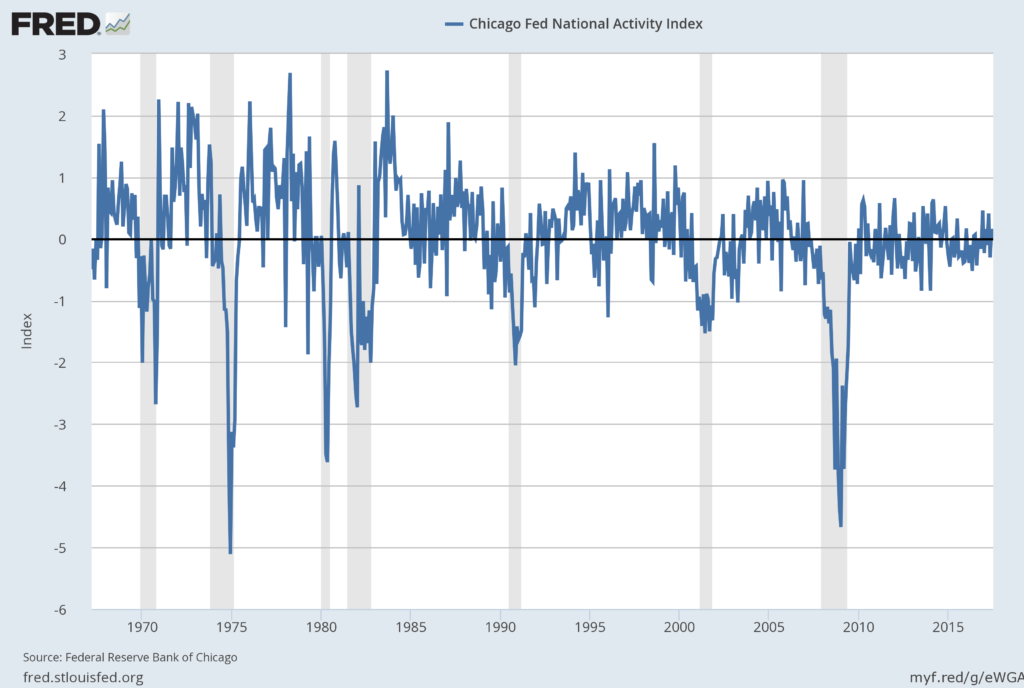
source: Federal Reserve Bank of Chicago, Chicago Fed National Activity Index [CFNAI], retrieved from FRED, Federal Reserve Bank of St. Louis; accessed September 3, 2017:
–
Another facet of economic activity is seen in the ratio of the Conference Board’s Coincident Composite Index to the Lagging Composite Index. I interpret the trends seen in this measure to be disconcerting, as the ratio has generally been sinking for years:
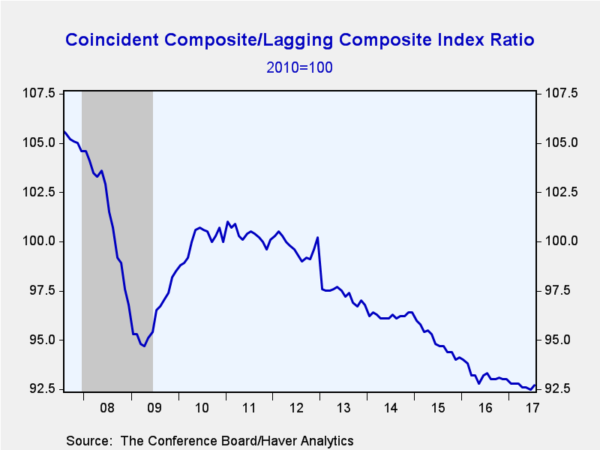
source: Haver’s August 17, 2017 post (“Widespread Gain for U.S. Leading Economic Indicators in July“)
–
Consumer Spending
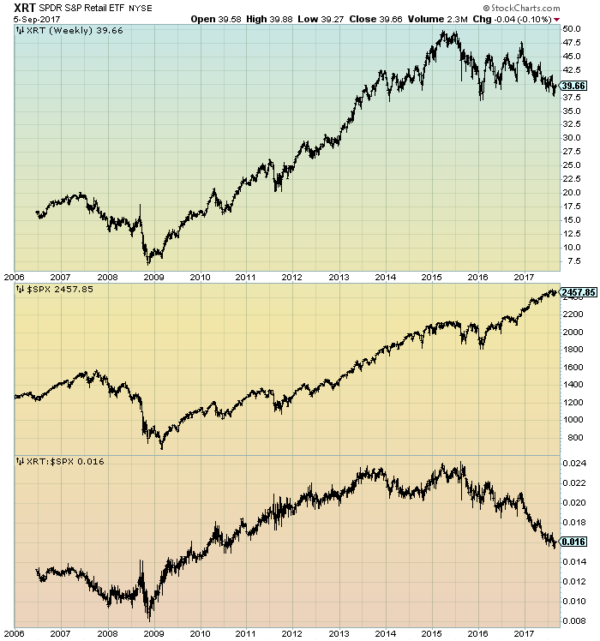
In the March 23, 2017 post (“‘Hidden’ Weakness In Consumer Spending?“) I wrote of various indications that consumer spending may be (substantially) less than what is depicted by various mainstream indicators, including overall retail sales. This weakness has widespread consequences for the U.S. economy, including the implications stemming from the substantial number of retail store closures.
There are many indications of retail weakness, including various stock charts. One is the underperformance of retailers to the overall stock market, as seen in the ratio of retail stocks (XRT as a proxy) to the S&P500. As seen below, XRT as a ratio to the S&P500 (bottom plot) has been declining since roughly mid-2015:
(click on chart to enlarge image)(chart courtesy of StockCharts.com; chart creation and annotation by the author)
Another worrisome aspect is the peaking in auto sales, with the accompanying widespread economic implications.
–
Construction Activity
Various construction measures are indicating lesser levels – if not contraction – of activity.
Among the most concerning charts is that for Total Nonresidential Construction Spending, on a “Percent Change From Year Ago” basis, as seen below: (current reading (through July) is $688,419 million):
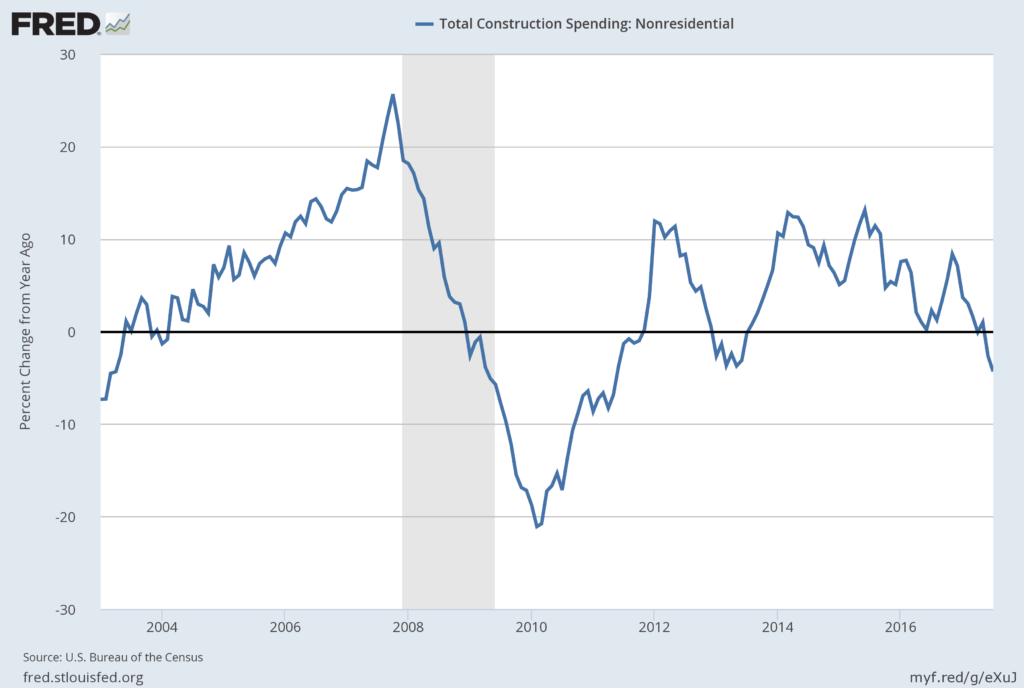
source: U.S. Bureau of the Census, Total Construction Spending: Nonresidential [TLNRESCONS], retrieved from FRED, Federal Reserve Bank of St. Louis; accessed September 5, 2017;
–
Inflation Trends
Current inflation levels and the possibility of deflation (when the CPI goes below zero) is a vastly complex topic, and as such isn’t suitably discussed in a brief manner. I have discussed the issue of deflation extensively as I continue to believe that outright sustained deflation will occur, with wide-ranging economic implications. As I have stated in past commentaries, my analyses indicate that surveys or “market-based” measures concerning deflation will not provide adequate “advance warning” of this deflation.
For reference, here is the “Core PCE” measure as of the August 31, 2017 update, showing data through July, with a current reading of 1.4%:
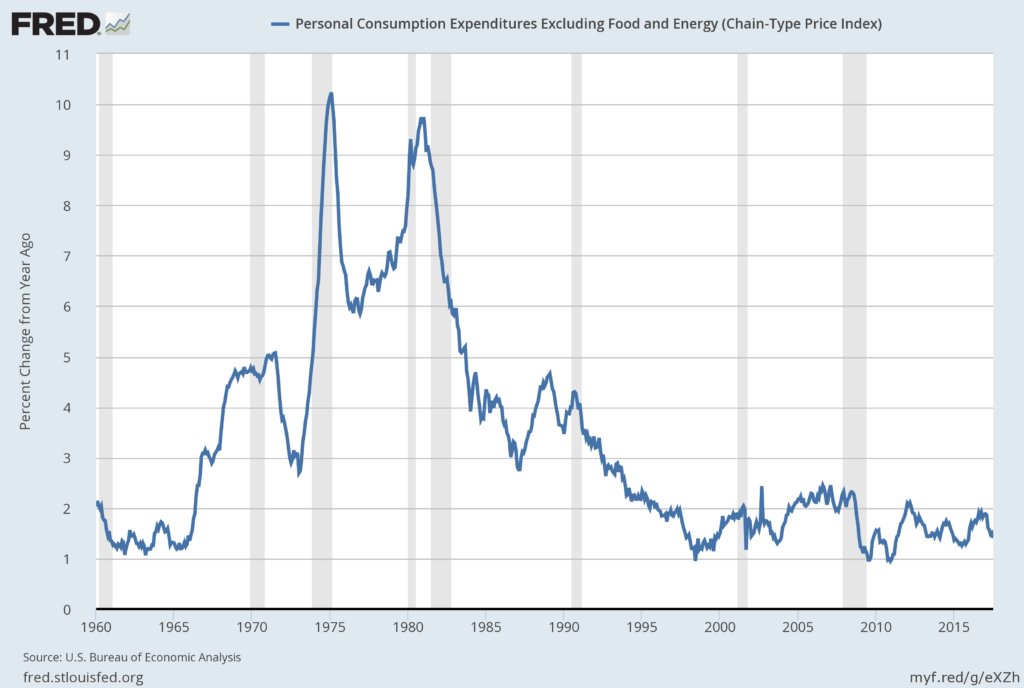
source: U.S. Bureau of Economic Analysis, Personal Consumption Expenditures Excluding Food and Energy (Chain-Type Price Index) [PCEPILFE], retrieved from FRED, Federal Reserve Bank of St. Louis; accessed September 6, 2017:
Other Indicators
As mentioned previously, many other indicators discussed on this site indicate economic weakness if not outright (substantially) problematical economic conditions.
_____
The Special Note summarizes my overall thoughts about our economic situation
SPX at 2457.85 as this post is written
No comments:
Post a Comment