Many people believe that the Yield Curve is an important economic indicator.
On March 1, 2010, I wrote a post on the issue, titled “The Yield Curve As A Leading Economic Indicator.”
An excerpt from that post:
On the NY Fed link above, they have posted numerous studies that support the theory that the yield curve is a leading indicator. My objections with using it as a leading indicator, especially now, are various. These objections include: I don’t think such a narrow measure is one that can be relied upon; both the yields at the short and long-end of the curve have been overtly and officially manipulated, thus distorting the curve; and, although the yield curve may have been an accurate leading indicator in the past, this period of economic weakness is inherently dissimilar in nature from past recessions and depressions in a multitude of ways – thus, historical yardsticks and metrics probably won’t (and have not) proven appropriate.
While I continue to have the above-stated reservations regarding the “yield curve” as an indicator, I do believe that it should be monitored.
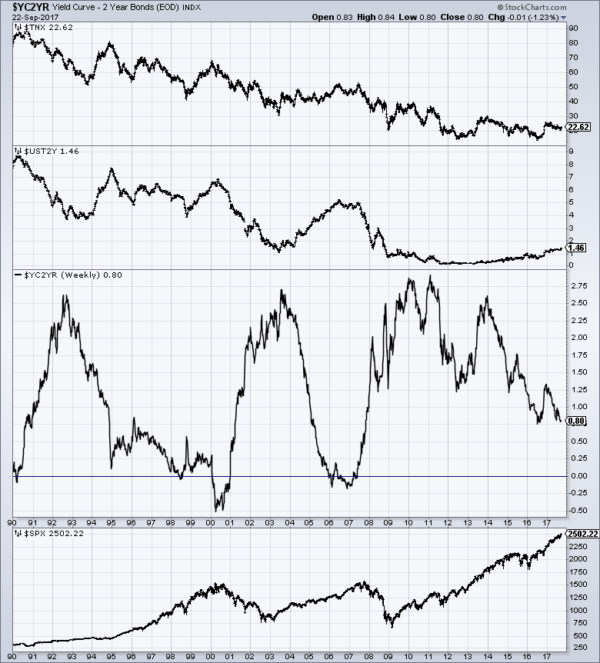
As an indication of the yield curve, below is a weekly chart from January 1, 1990 through September 22, 2017. The top two plots show the 10-Year Treasury and 2-Year Treasury yields. The third plot shows the (yield) spread between the 10-Year Treasury and 2-Year Treasury, with the September 22, 2017 closing value of .80%. The bottom plot shows the S&P500:
(click on chart to enlarge image)(chart courtesy of StockCharts.com; chart creation and annotation by the author)
Additionally, below is a chart showing the same spread between the 10-Year Treasury and 2-Year Treasury, albeit with a slightly different measurement, using constant maturity securities. This daily chart is from June 1, 1976 through September 21, 2017, with recessionary periods shown in gray. This chart shows a value of .82%:
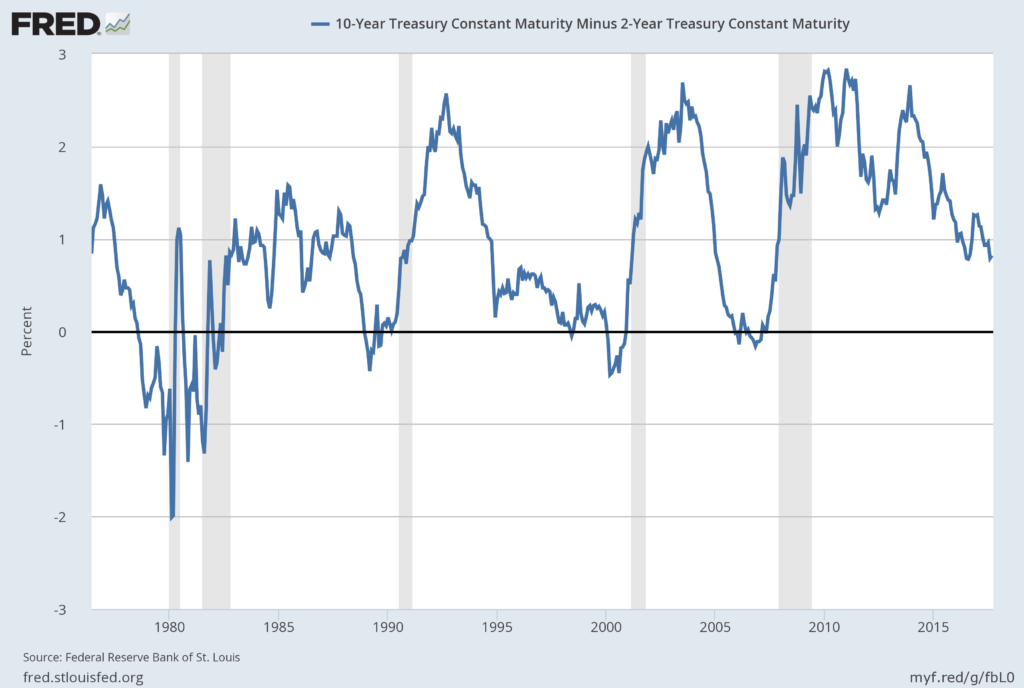
source: Federal Reserve Bank of St. Louis, 10-Year Treasury Constant Maturity Minus 2-Year Treasury Constant Maturity [T10Y2Y], retrieved from FRED, Federal Reserve Bank of St. Louis; accessed September 25, 2017:
_____
The Special Note summarizes my overall thoughts about our economic situation
SPX at 2502.22 as this post is written
No comments:
Post a Comment