U.S. Economic Indicators
Throughout this site there are many discussions of economic indicators. At this time, the readings of various indicators are especially notable. This post is the latest in a series of posts indicating U.S. economic weakness or a notably low growth rate.
While many U.S. economic indicators – including GDP – are indicating economic growth, others depict (or imply) various degrees of weak growth or economic contraction. As seen in the June 2019 Wall Street Journal Economic Forecast Survey the consensus (average estimate) among various economists is for 2.2% GDP growth in 2019 and 1.6% GDP growth in 2020. However, there are other broad-based economic indicators that seem to imply a weaker growth rate.
As well, it should be remembered that GDP figures can be (substantially) revised.
Charts Indicating U.S. Economic Weakness
Below are a small sampling of charts that depict weak growth or contraction, and a brief comment for each:
Total Federal Receipts
“Total Federal Receipts” growth continues to be intermittent in nature since 2015. As well, the level of growth does not seem congruent to the (recent) levels of economic growth as seen in aggregate measures such as Real GDP.
“Total Federal Receipts” through June had a last monthly value of $333,592 Million. Shown below is the measure displayed on a “Percent Change From Year Ago” basis with value 5.6%, last updated July 11, 2019:
![Total Federal Receipts [MTSR133FMS]](https://www.economicgreenfield.com/wp-content/uploads/2019/07/MTSR133FMS_7-11-19-333592-5.6-Percent-Change-From-Year-Ago.png)
source: U.S. Department of the Treasury. Fiscal Service, Total Federal Receipts [MTSR133FMS], retrieved from FRED, Federal Reserve Bank of St. Louis; accessed July 11, 2019:
https://fred.stlouisfed.org/series/MTSR133FMS
https://fred.stlouisfed.org/series/MTSR133FMS
__
Regional Manufacturing Surveys
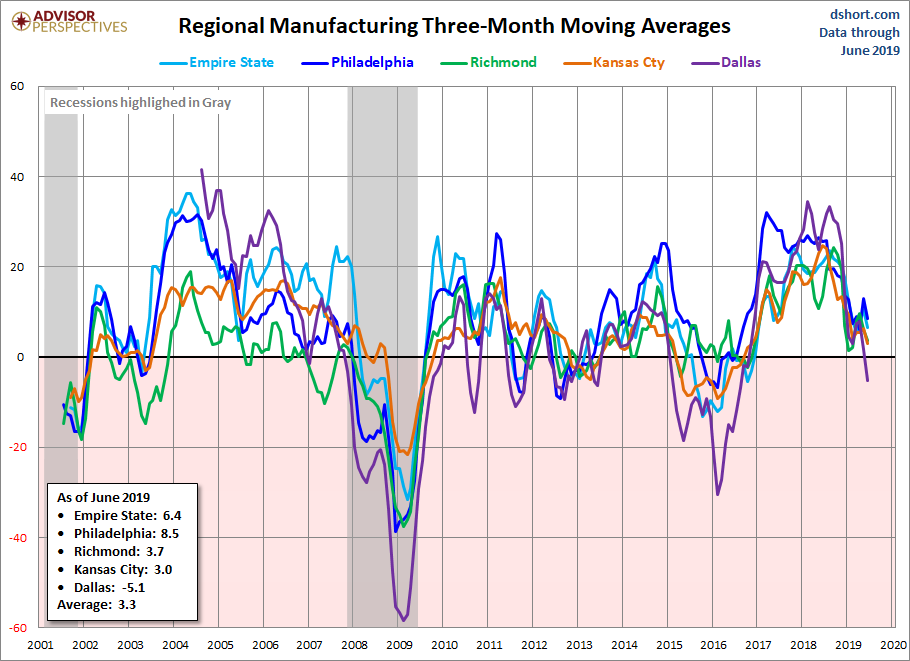
Various Federal Reserve regional manufacturing surveys are indicating either a significant weakening in growth or a decline in various aspects of activity.
Below is a chart of various regional manufacturing surveys, depicted on a 3-month moving average, from Doug Short’s site post of June 27, 2019 titled “June Regional Fed Manufacturing Overview“:
__
Average Weekly Overtime Hours of Production and Nonsupervisory Employees: Manufacturing (AWOTMAN)
Another indication of weakening manufacturing activity is overtime hours. Shown below is the “Average Weekly Overtime Hours of Production and Nonsupervisory Employees: Manufacturing” measure (with last value of 4.2 hours through June) displayed on a “Percent Change From Year Ago” basis with value -6.7%, last updated July 5, 2019:
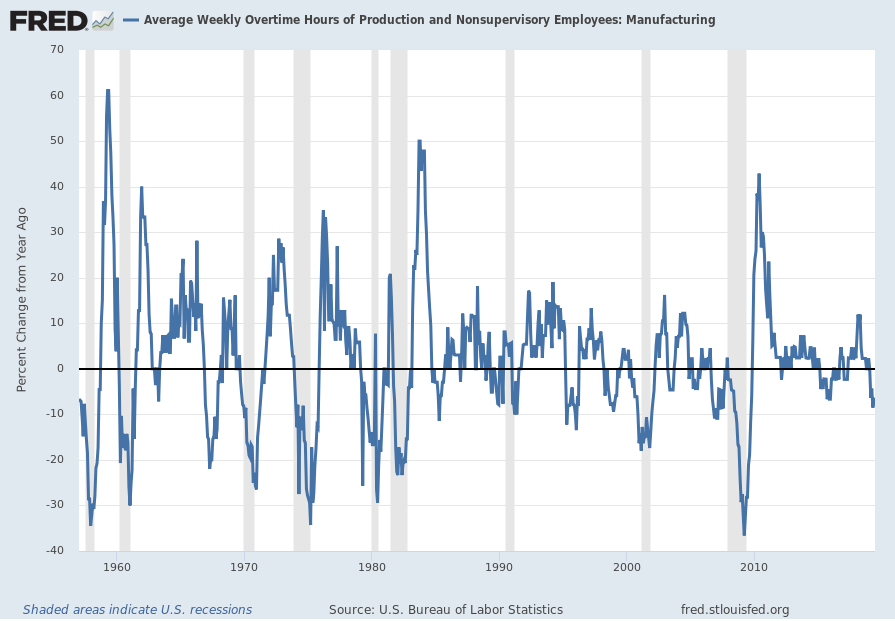
source: U.S. Bureau of Labor Statistics, Average Weekly Overtime Hours of Production and Nonsupervisory Employees: Manufacturing [AWOTMAN], retrieved from FRED, Federal Reserve Bank of St. Louis; accessed July 8, 2019: https://fred.stlouisfed.org/series/AWOTMAN
__
Industrial Production: Consumer Goods (IPCONGD)
The “Industrial Production: Consumer Goods” measure is currently exhibiting weak year-over-year growth. Shown below is this measure (with last value of 105.0804 through May) displayed on a “Percent Change From Year Ago” basis with value .1%, last updated June 14, 2019:
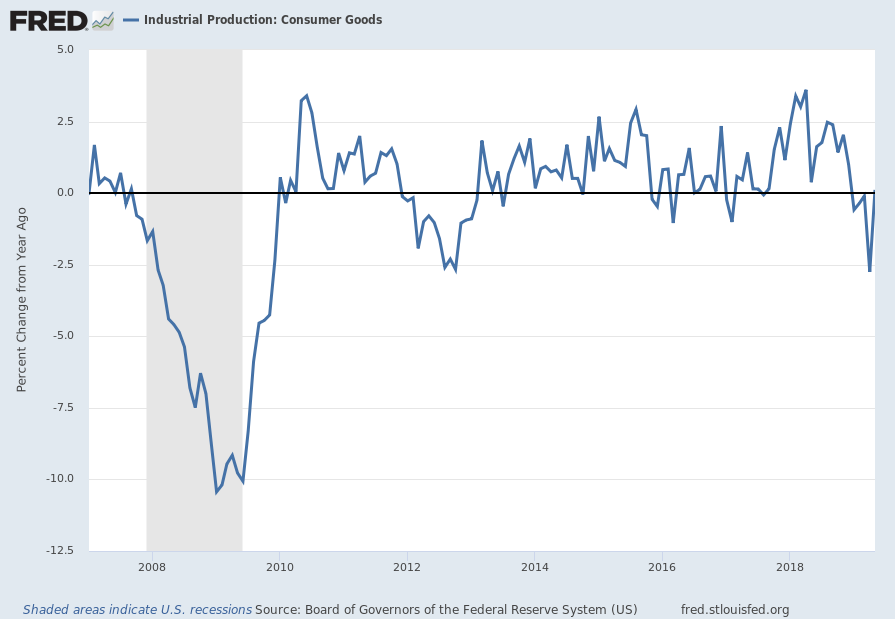
source: Board of Governors of the Federal Reserve System (US), Industrial Production: Consumer Goods [IPCONGD], retrieved from FRED, Federal Reserve Bank of St. Louis; accessed July 7, 2019:https://fred.stlouisfed.org/series/IPCONGD
__
New Manufacturing Orders For Consumer Goods Excluding Transportation Industries (ADXTNO)
Another measure for consumer goods exhibiting a weakening (on a YoY basis) growth trend is the “Value of Manufacturers’ New Orders for Consumer Goods: Durable Goods Excluding Transportation Industries” (ADXTNO). Shown below is this measure (with last value of $163,477 Million through May) displayed on a “Percent Change From Year Ago” basis with value .3%, last updated July 3, 2019:
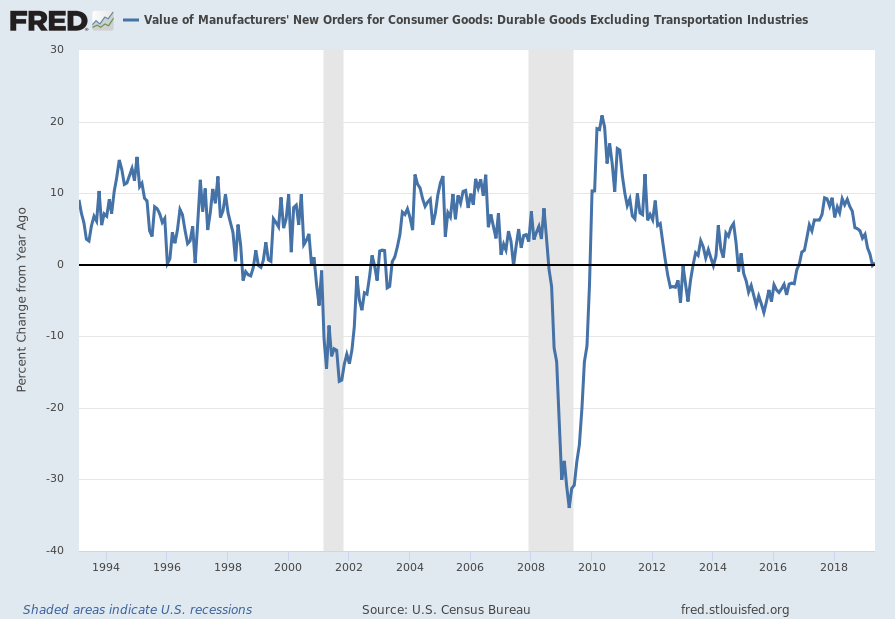
source: U.S. Census Bureau, Value of Manufacturers’ New Orders for Consumer Goods: Durable Goods Excluding Transportation Industries [ADXTNO], retrieved from FRED, Federal Reserve Bank of St. Louis; accessed July 10, 2019: https://fred.stlouisfed.org/series/ADXTNO
__
Other Indicators
As mentioned previously, many other indicators discussed on this site indicate economic weakness or economic contraction, if not outright (gravely) problematical economic conditions.
_____
The Special Note summarizes my overall thoughts about our economic situation
SPX at 2999.91 as this post is written
No comments:
Post a Comment