U.S. Economic Indicators
Throughout this site there are many discussions of economic indicators. This post is the latest in a series of posts indicating facets of U.S. economic weakness or a notably low growth rate.
The level and trend of economic growth is especially notable at this time. As seen in various measures and near-term projections, the U.S. economy had undergone an outsized level of economic contraction in 2020. However, most people believe (and virtually all prominent economic forecasts indicate) that this historic level of contraction will have proven ephemeral in nature; i.e. an economic expansion will continue.
As seen in the April 2022 Wall Street Journal Economic Forecast Survey the consensus (average estimate) among various economists is for 2.57% GDP growth in 2022, 2.18% GDP growth in 2023, and 2.06% GDP growth in 2024.
Charts Indicating U.S. Economic Weakness
Below are a small sampling of charts that depict weak growth or contraction, and a brief comment for each:
__
The Yield Curve
Many people believe that the Yield Curve is a leading economic indicator for the United States economy.
On March 1, 2010, I wrote a post on the issue, titled “The Yield Curve As A Leading Economic Indicator.”
While I continue to have the stated reservations regarding the “Yield Curve” as an indicator, I do believe that it should be monitored.
The U.S. Yield Curve (one proxy seen below) while positive, is (all things considered) relatively low when viewed from a long-term perspective. Below is the spread between the 10-Year Treasury Constant Maturity and the 2-Year Treasury Constant Maturity from June 1976 through the April 8, 2022 value, showing a value of .19% [10-Year Treasury Yield (FRED DGS10) of 2.66% as of the April 8 update, 2-Year Treasury Yield (FRED DGS2) of 2.47% as of the April 8 update]:
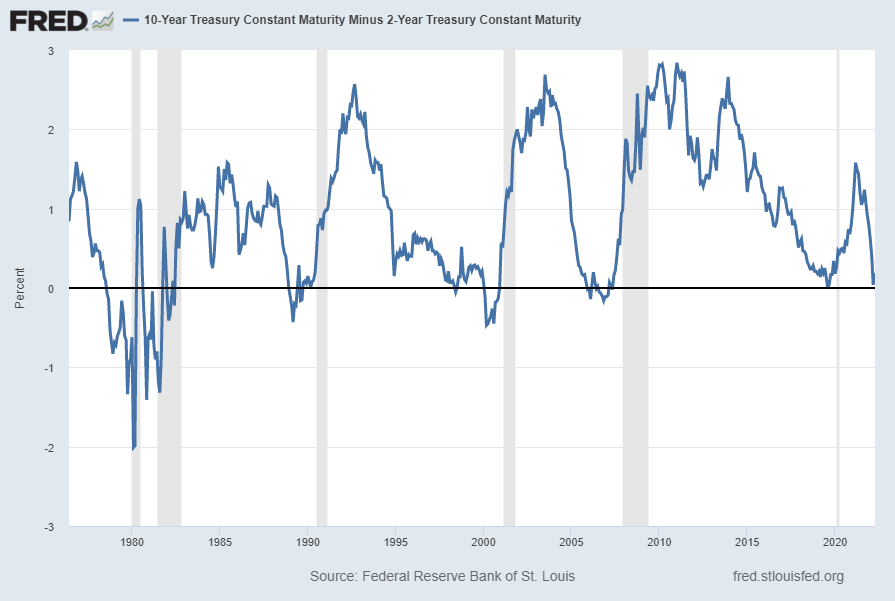
source: Federal Reserve Bank of St. Louis, 10-Year Treasury Constant Maturity Minus 2-Year Treasury Constant Maturity [T10Y2Y], retrieved from FRED, Federal Reserve Bank of St. Louis; accessed April 11, 2022: https://fred.stlouisfed.org/series/T10Y2Y
__
Real Average Hourly Earnings
Various measures of (nominal) average hourly earnings continue to show significant growth. However, due to continuing high inflation, Real Average Hourly Earnings continues to shrink. Shown below is a chart of various inflation-adjusted earnings measures as seen in The Economics Daily of March 16 titled “Real average hourly earnings decreased 2.6 percent from February 2021 to February 2022”:
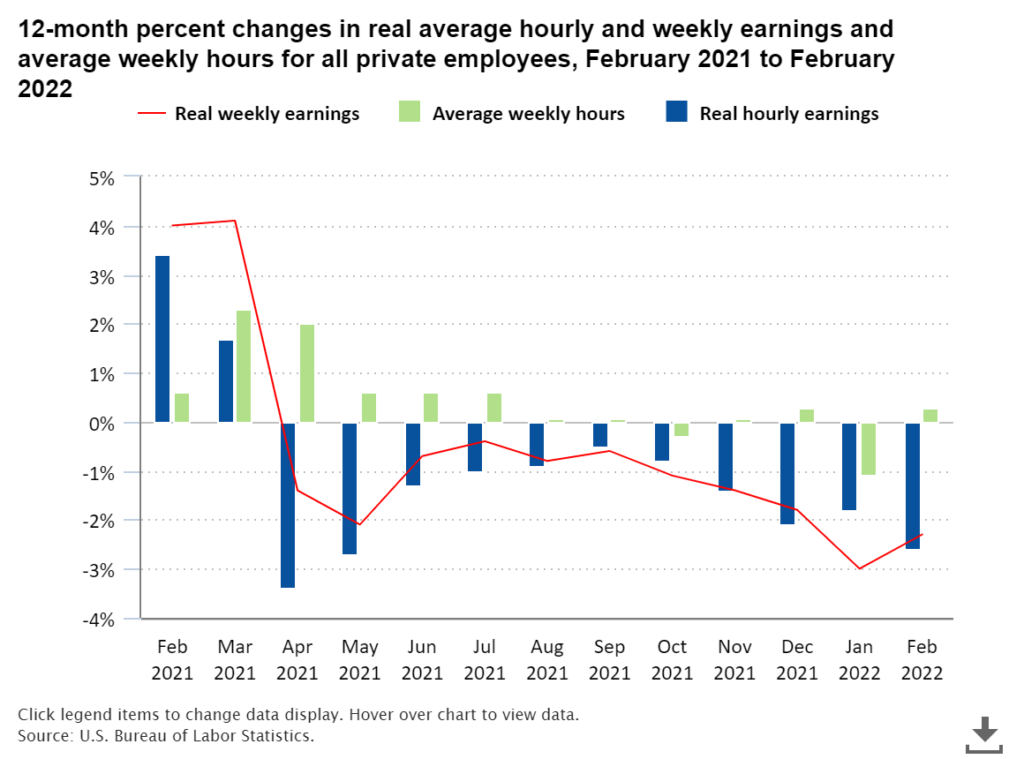
source: Bureau of Labor Statistics, U.S. Department of Labor, The Economics Daily, Real average hourly earnings decreased 2.6 percent from February 2021 to February 2022 at https://www.bls.gov/opub/ted/2022/real-average-hourly-earnings-decreased-2-6-percent-from-february-2021-to-february-2022.htm (visited April 11, 2022).
__
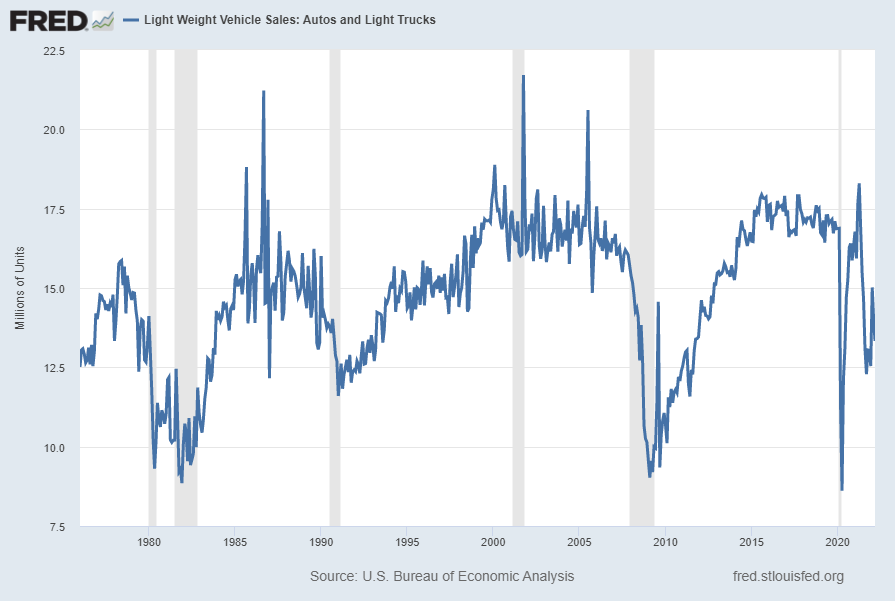
Auto Sales (ALTSALES)
Auto sales have an extensive impact on economic activity. Recent auto sales appear to be (highly) impacted by vehicle availability. Shortages, most notably in semiconductors, has curtailed vehicle supply. Auto sales, according to the current reading (through March 2022, updated on April 8, 2022) is 13.333 million vehicles SAAR. As shown below, this is a substantial decline when viewed against recent sales trends:
Seen below is this same measure on a “Percent Change From Year Ago” basis, with value -24.4%:
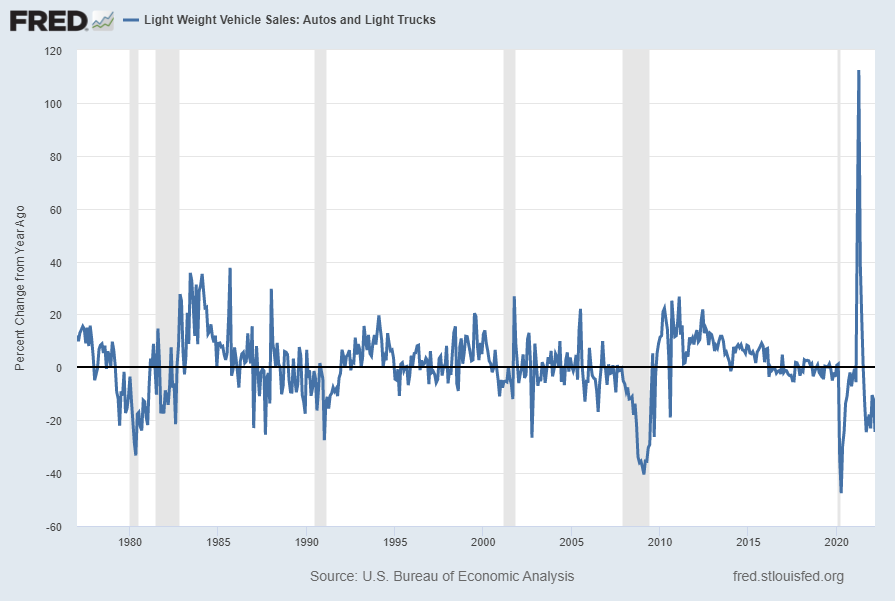
source: U.S. Bureau of Economic Analysis, Light Weight Vehicle Sales: Autos and Light Trucks [ALTSALES], retrieved from FRED, Federal Reserve Bank of St. Louis; accessed April 11, 2022: https://fred.stlouisfed.org/series/ALTSALES
__
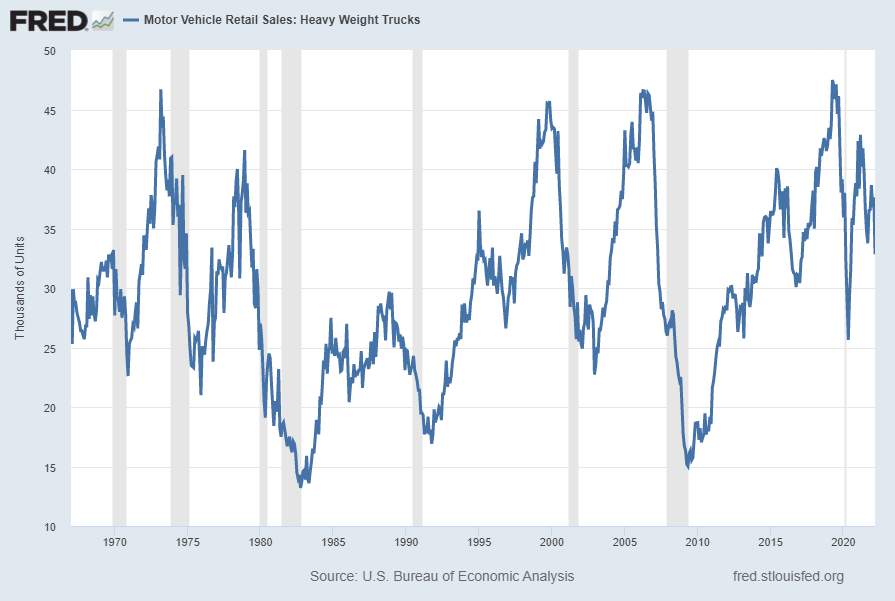
Motor Vehicle Retail Sales: Heavy Weight Trucks (HTRUCKSSA)
Sales of “Heavy Weight Trucks” (HTRUCKSSA) has recently been volatile. Shown below is this measure with last value of 32.846 Thousand through March 2022, last updated April 8, 2022:
Below is this measure displayed on a “Percent Change From Year Ago” basis with value -23.4%:
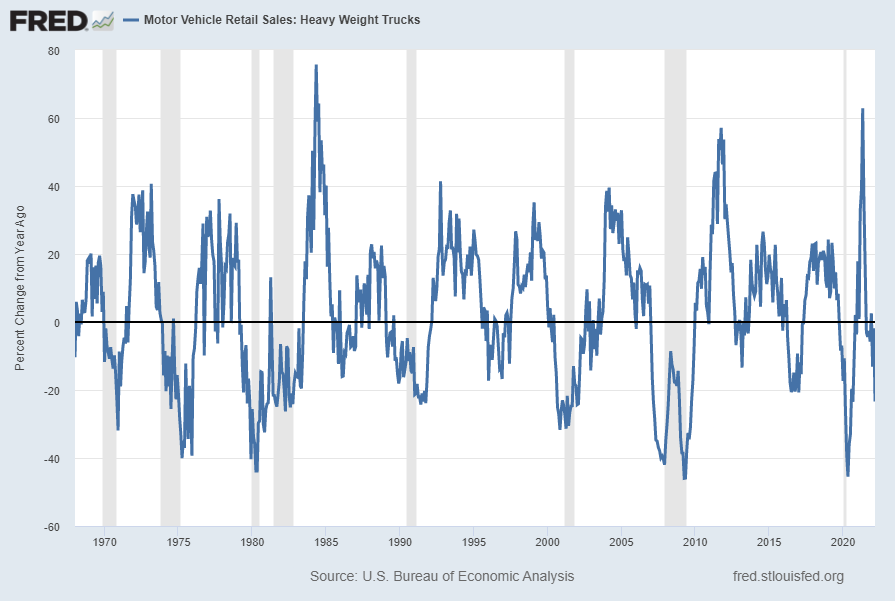
source: U.S. Bureau of Economic Analysis, Motor Vehicle Retail Sales: Heavy Weight Trucks [HTRUCKSSA], retrieved from FRED, Federal Reserve Bank of St. Louis; accessed April 11, 2022: https://fred.stlouisfed.org/series/HTRUCKSSA
__
Other Indicators
As mentioned previously, many other indicators discussed on this site indicate slow economic growth or economic contraction, if not outright (gravely) problematical economic conditions.
_____
The Special Note summarizes my overall thoughts about our economic situation
SPX at 4435.90 as this post is written
No comments:
Post a Comment