Saturday, June 23, 2012

Ben Bernanke’s June 20, 2012 Press Conference – Notable Aspects


On Wednesday, June 20, 2012 Ben Bernanke gave his scheduled press conference.

Here are Ben Bernanke’s comments I found most notable - although I don't necessarily agree with them - in the order they appear in the transcript.  These comments are excerpted from the "Transcript of Chairman Bernanke’s Press Conference"(preliminary)(pdf) of June 20, 2012, with accompanying Economic Projections of Federal Reserve Board Members and Federal Reserve Bank Presidents, June 2012 (pdf).

Bernanke’s responses as indicated to the various questions:

Friday, June 22, 2012

Articles Remembering Anna J. Schwartz


Two well-written articles remembering the life of Anna J. Schwartz include the June 21 New York Times article titled "Anna Schwartz, Economist Who Worked With Friedman, Dies at 96" as well as the June 22 Bloomberg BusinessWeek article titled "Anna Schwartz, Economist Milton Friedman's Co-Author, Dies at 96."

Although both article are well worth reading in their entirety, I would like to highlight some excerpts from the Bloomberg BusinessWeek article:
The first book that Schwartz wrote with Friedman, “A Monetary History of the United States, 1867-1960,” had “critical influence” on the outlook “of a generation of policy makers,” Bernanke said in 2003, when he was a Fed governor.
Published in 1963, the book advanced the idea that the Great Depression had been triggered by the central bank’s reduction in the U.S. money supply from 1928 until the early 1930s. That contradicted the prevailing view that it resulted from the 1929 stock-market crash.
also:
In a 2008 interview with Barron’s, Schwartz said the government needed to stop injecting liquidity into markets and reacting to the credit crisis with ad hoc programs.
“If I regret one thing, it’s that Milton Friedman isn’t alive to see what’s happening today,” she told the magazine. Referring to Bernanke, she said, “It’s like the only lesson the Federal Reserve took from the Great Depression was to flood the market with liquidity. Well, it isn’t working.”
Schwartz said in a July 2009 commentary for the New York Times that Bernanke, the architect of the central bank’s emergency programs, didn’t deserve reappointment as Fed chief.
“Mr. Bernanke seems to know only two amounts: zero and trillions,” she said, referring to his policy of holding the target interest rate near zero and the expansion of the Fed’s assets to $2 trillion in July 2009, more than double the level of early 2008. The U.S. Senate’s 70-30 vote to approve Bernanke for a second four-year term in 2010 marked the greatest opposition to a Fed chairman since the office became subject to Senate confirmation in 1978.
-

My comments: 

For those unaware, the aforementioned "A Monetary History of the United States, 1867-1960" seems to have had an almost monumental influence on multiple fronts.  While my thoughts on the book are complex - especially with regard to its description and interpretation of The Great Depression - the book appears to have had immense influence on both the putative causes of The Great Depression as well as a preeminent reference as how to avoid Depression conditions.  It strongly appears as if the book has had a strong influence on Ben Bernanke's economic interpretations and actions.

I highlighted the quotes and thoughts from Anna Schwartz concerning the various intervention efforts from 2007, as well as her thoughts on Ben Bernanke's actions, as I believe these thoughts deserve greater recognition.
_____

The Special Note summarizes my overall thoughts about our economic situation

SPX at 1331.50 as this post is written

St. Louis Financial Stress Index – June 21, 2012 Update


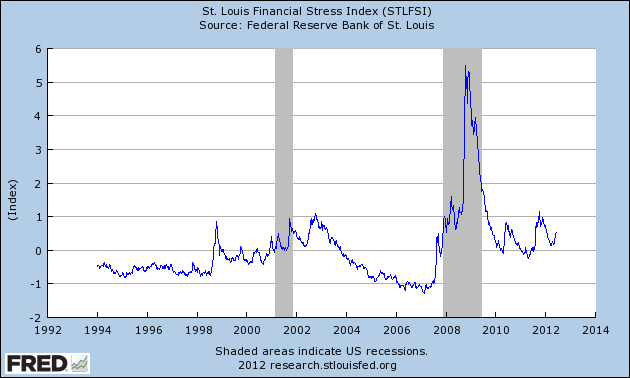
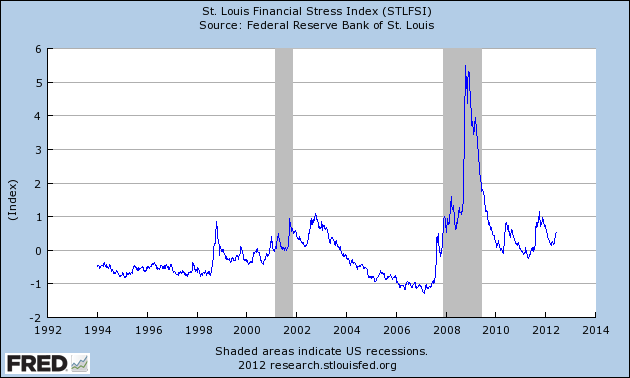
On March 28, 2011 I wrote a post ("The STLFSI") about the  STLFSI (St. Louis Fed’s Financial Stress Index) which is supposed to measure stress in the financial system.  For reference purposes, the most recent chart is seen below.  This chart was last updated on June 21, incorporating data from December 31,1993 to June 15, 2012 on a weekly basis.  The June 15, 2012 value is .525 :


_________

I post various indicators and indices because I believe they should be carefully monitored.  However, as those familiar with this blog are aware, I do not necessarily agree with what they depict or imply.
_____

The Special Note summarizes my overall thoughts about our economic situation

SPX at 1325.51 as this post is written

Thursday, June 21, 2012

The S&P500 Vs. The Shanghai Stock Exchange Composite Index – June 21, 2012


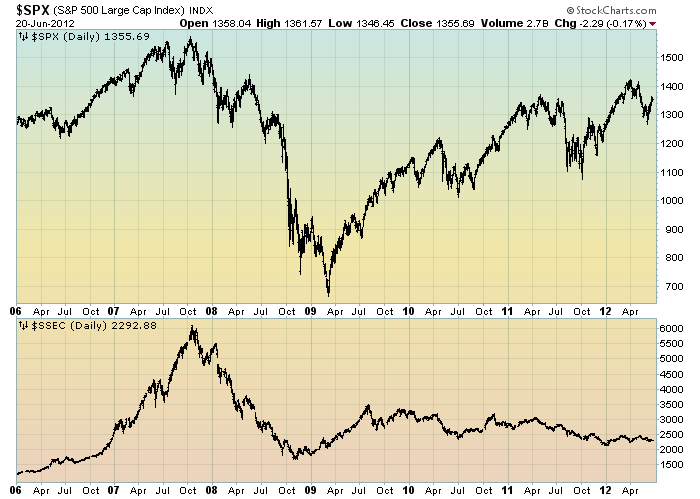
Starting on May 3, 2010 I have written posts concerning the notable divergence that has occurred between the S&P500 and Chinese (Shanghai Composite) stock markets.

The chart below illustrates this divergence; it shows the S&P500 vs. the Shanghai Composite on a daily basis, since 2006:

(click on chart to enlarge image)(chart courtesy of StockCharts.com; chart creation and annotation by the author)


-

It is notable that the Shanghai Composite led the SPX (S&P500) significantly in late ’08 – early ’09, yet it has been (gradually) declining since that time.

I continue to find this divergence between the S&P500 and  Shanghai Composite to be notable and disconcerting, on an “all things considered” basis.

_____

The Special Note summarizes my overall thoughts about our economic situation

SPX at 1355.69 as this post is written

Tuesday, June 19, 2012

The June 2012 Wall Street Journal Economic Forecast Survey


The June Wall Street Journal Economic Forecast Survey was published on June 16, 2012.  The headline is “Recovery Slows as Global Risks Rise.”

I found various excerpts to be notable, including the following:
Most economists still expect the U.S. to avoid falling into a recession. But they project lackluster growth of about 2% for the rest of the year, a pace that is too slow to bring down the unemployment rate and that leaves little buffer if the crisis in Europe deepens, which many experts believe is likely as Greek citizens head to the polls on Sunday.
The downshift is a reversal from earlier this year, when several months of strong job growth and accelerating consumer spending buoyed hopes that the U.S. was finally breaking out of its slump. Many economists suggested the recovery at last had enough momentum to carry it through another patch of grim news at home or abroad.
Also, as seen in the Q&A section (in the spreadsheet), the economists responded that the "probability of a recession in the U.S. in the next 12 months" averages 19%;  furthermore, as to whether "the risk to your 2012 growth forecast" is "more to the upside or downside," 91% said to the downside.


The current average forecasts among economists polled include the following:

GDP:
full-year 2012:  2.3%
full-year 2013:  2.5%
full-year 2014:  3.0%

Unemployment Rate:
December 2012: 7.9%
December 2013: 7.5%
December 2014:  6.9%

10-Year Treasury Yield:
December 2012: 2.12%
December 2013: 2.83%
December 2014:  3.47%

CPI:
December 2012:  2.0%
December 2013:  2.3%
December 2014:  2.5%

Crude Oil  ($ per bbl):
for 12/31/2012: $89.81

(note: I highlight this WSJ Economic Forecast survey each month; commentary on past surveys can be found under the “Economic Forecasts” label)

_____

I post various economic forecasts because I believe they should be carefully monitored.  However, as those familiar with this blog are aware, I do not necessarily agree with many of the consensus estimates and much of the commentary in these forecast surveys.
_____

The Special Note summarizes my overall thoughts about our economic situation

SPX at 1357.26 as this post is written

Monday, June 18, 2012

Food Stamps As Of May 31, 2012


This post is an update to previous posts concerning food stamps.  The program is officially called “Supplemental Nutrition Assistance Program,” or SNAP.  As stated on the SNAP website, “As of Oct. 1, 2008, Supplemental Nutrition Assistance Program (SNAP) is the new name for the federal Food Stamp Program.”

The data was last updated May 31, 2012, reflecting March 2012 levels.

Here is a table showing various monthly statistics with regard to national participation and costs going back to FY2009.  As seen in this table, the number of people participating as of March 2012 is 46,405,204 up 4.07% from year-ago (March 2011) levels.  As a reference point, the figure as of June 2009 (the official end of the recession as defined by the NBER) was 34,882,031.  Longer-term annual data is also available.

As I wrote in the April 12, 2010 post, “Of course, what is particularly disconcerting is not only the extent of participation in these programs, but the fact that this is yet another notable statistic that is getting worse well after the purported end of the recession.”
_____

The Special Note summarizes my overall thoughts about our economic situation

SPX at 1347.57 as this post is written

Sunday, June 17, 2012

Long-Term Charts Of The ECRI WLI & ECRI WLI, Gr. – June 15, 2012 Update


As I stated in my July 12, 2010 post ("ECRI WLI Growth History"):
For a variety of reasons, I am not as enamored with ECRI’s WLI and WLI Growth measures as many are.
However, I do think the measures are important and deserve close monitoring and scrutiny.
The movement of the ECRI WLI and WLI, Gr. is particularly notable at this time, as ECRI publicly announced on September 30, 2011 that the U.S. was “tipping into recession,” and ECRI has reaffirmed that view since, including a notable statement on March 15 (“Why Our Recession Call Stands”) as well as various interviews and statements the week of May 6, including:


Wall Street Journal video, May 9: “Free Market Economies Have Business Cycles


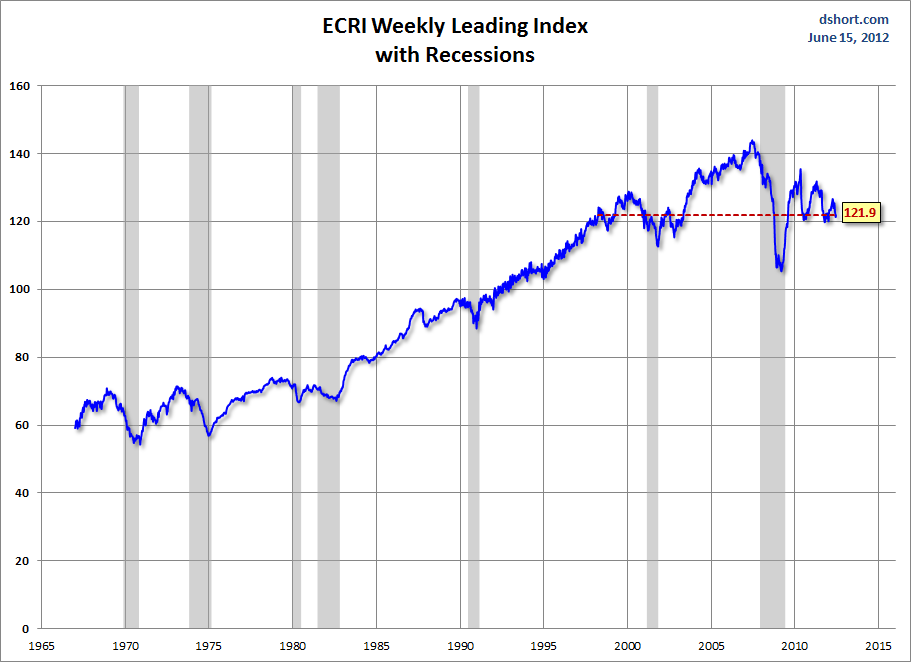
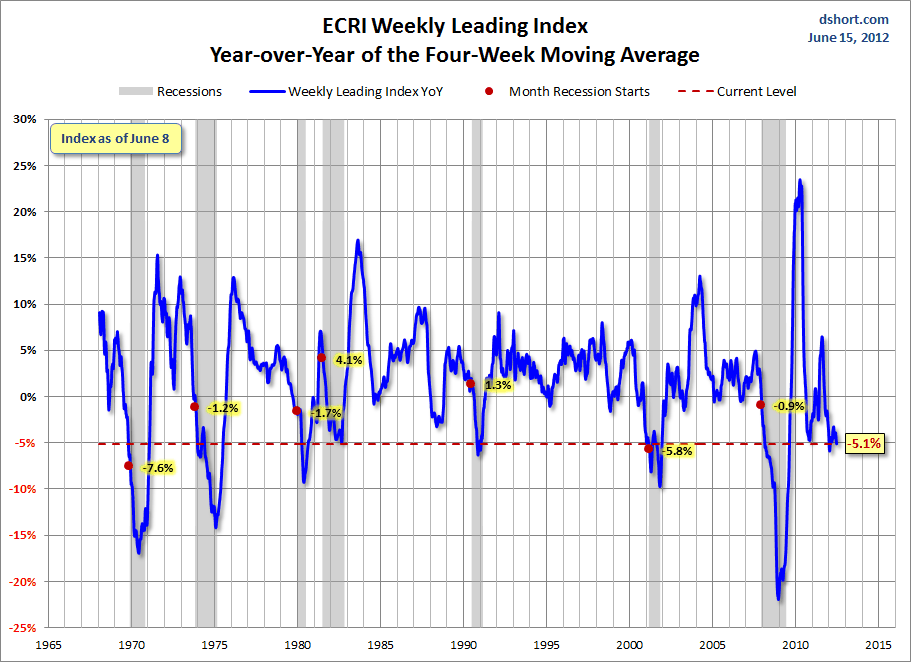
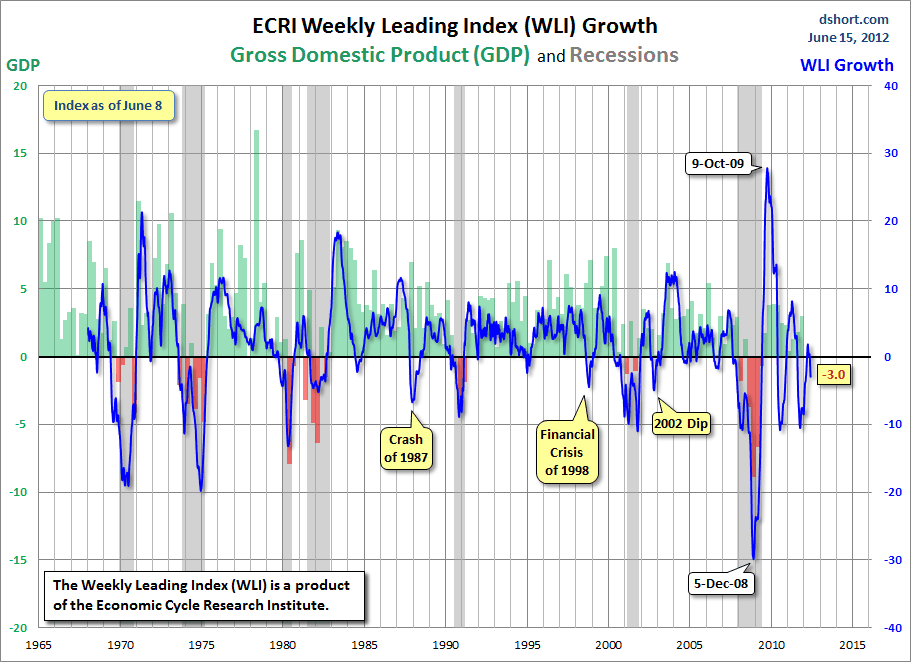
Below are three long-term charts, from Doug Short’s blog post of June 15 titled “ECRI Recession Call:  Weekly Leading Index Up Slightly, But Growth Index Declines.”  These charts are on a weekly basis through the June 15 release, indicating data through June 8.

Here is the ECRI WLI (defined at ECRI’s glossary):

(click on charts to enlarge images)


-

This next chart depicts, on a long-term basis, the Year-over-Year change in the 4-week moving average of the WLI:


-

This last chart depicts, on a long-term basis, the WLI, Gr.:


_________

I post various economic indicators and indices because I believe they should be carefully monitored.  However, as those familiar with this blog are aware, I do not necessarily agree with what they depict or imply.
_____

The Special Note summarizes my overall thoughts about our economic situation

SPX at 1342.84 as this post is written

Friday, June 15, 2012

St. Louis Financial Stress Index – June 14, 2012 Update


On March 28, 2011 I wrote a post ("The STLFSI") about the  STLFSI (St. Louis Fed’s Financial Stress Index) which is supposed to measure stress in the financial system.  For reference purposes, the most recent chart is seen below.  This chart was last updated on June 14, incorporating data from December 31,1993 to June 8, 2012 on a weekly basis.  The June 8, 2012 value is .536 :


_________

I post various indicators and indices because I believe they should be carefully monitored.  However, as those familiar with this blog are aware, I do not necessarily agree with what they depict or imply.
_____

The Special Note summarizes my overall thoughts about our economic situation

SPX at 1329.10 as this post is written