Friday, May 10, 2013

Long-Term Charts Of The ECRI WLI & ECRI WLI, Gr. – May 10, 2013 Update


As I stated in my July 12, 2010 post ("ECRI WLI Growth History"):
For a variety of reasons, I am not as enamored with ECRI’s WLI and WLI Growth measures as many are.
However, I do think the measures are important and deserve close monitoring and scrutiny.
The movement of the ECRI WLI and WLI, Gr. is particularly notable at this time, as ECRI publicly announced on September 30, 2011 that the U.S. was “tipping into recession,” and ECRI has reiterated the view that the U.S. economy is currently in a recession, seen most recently in these four sources :
Other past notable 2012 reaffirmations of the September 30, 2011 recession call by ECRI were seen (in chronological order)  on March 15 (“Why Our Recession Call Stands”) as well as various interviews and statements the week of May 6, including:
Also, subsequent to May 2012:
-

Below are three long-term charts, from Doug Short’s blog post of May 10 titled “Recession Watch:  ECRI’s Weekly Leading Indicator Continues to Show Improvement.”  These charts are on a weekly basis through the May 10 release, indicating data through May 3, 2013.

Here is the ECRI WLI (defined at ECRI’s glossary):

(click on charts to enlarge images)
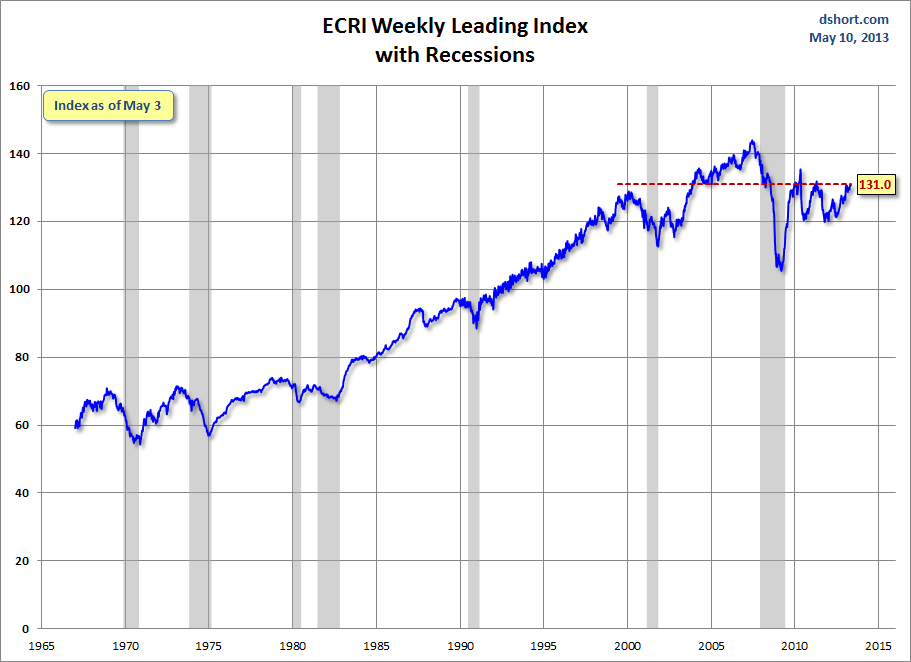
Dshort 5-10-13 ECRI-WLI 131.0

-

This next chart depicts, on a long-term basis, the Year-over-Year change in the 4-week moving average of the WLI:
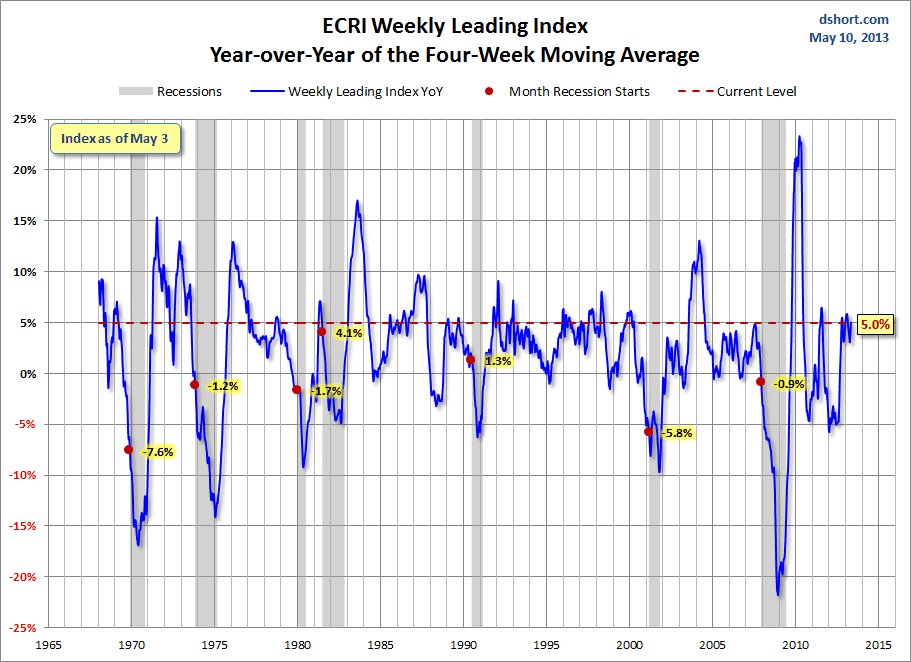
Dshort 5-10-13 ECRI-WLI-YoY 5.0 percent

-

This last chart depicts, on a long-term basis, the WLI, Gr.:
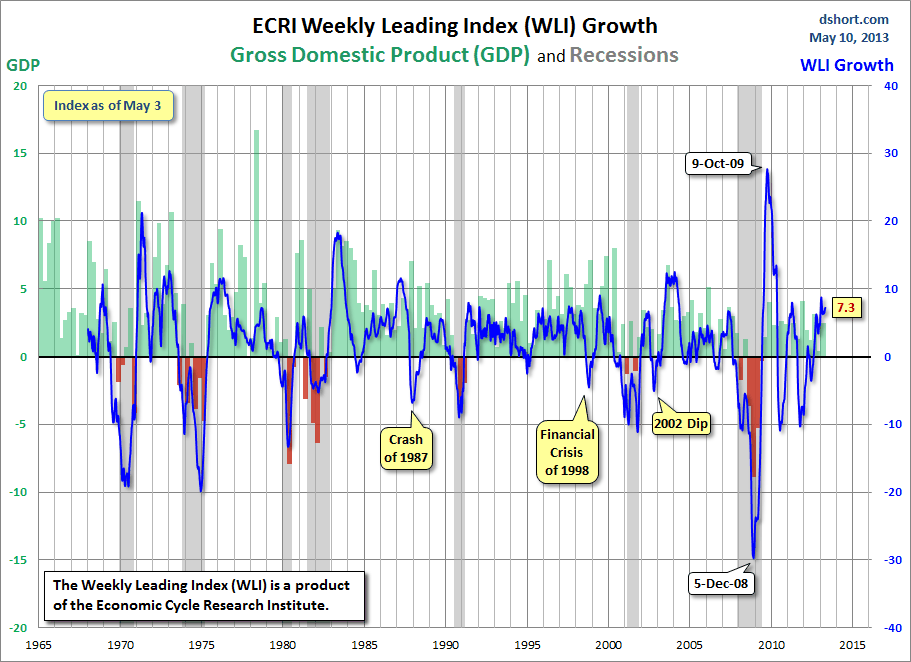
Dshort 5-10-13 ECRI-WLI-growth-since-1965 7.3

_________

I post various economic indicators and indices because I believe they should be carefully monitored.  However, as those familiar with this blog are aware, I do not necessarily agree with what they depict or imply.
_____

The Special Note summarizes my overall thoughts about our economic situation

SPX at 1629.70 as this post is written

St. Louis Financial Stress Index – May 9, 2013 Update


On March 28, 2011 I wrote a post ("The STLFSI") about the  St. Louis Fed’s Financial Stress Index (STLFSI) which is supposed to measure stress in the financial system.  For reference purposes, the most recent chart is seen below.  This chart was last updated on May 9, incorporating data from December 31,1993 to May 3, 2013, on a weekly basis.  The May 3, 2013 value is -.719 :

(click on chart to enlarge image)

STLFSI_5-9-13 -.719

-

Here is the STLFSI chart from a 1-year perspective:

STLFSI_5-9-13 -.719 1-year

Data Source: FRED, Federal Reserve Economic Data, Federal Reserve Bank of St. Louis; accessed May 10, 2013:
_________

I post various indicators and indices because I believe they should be carefully monitored.  However, as those familiar with this blog are aware, I do not necessarily agree with what they depict or imply.
_____

The Special Note summarizes my overall thoughts about our economic situation

SPX at 1626.67 as this post is written

Thursday, May 9, 2013

Deflation Probabilities


While I do not agree with the current readings of the measure – I think the measure dramatically understates the probability of deflation, as measured by the CPI – the Federal Reserve Bank of Atlanta maintains an interesting data series titled “Deflation Probabilities.”

As stated on the site:
Using estimates derived from Treasury Inflation-Protected Securities (TIPS) markets, described in a technical appendix, this weekly report provides two measures of the probability of consumer price index (CPI) deflation through 2017.
A chart shows the trends of the two probabilities.  As one can see in the chart, the readings are volatile.
As for the current weekly reading, the May 9 update states the following:
One measure of the probability of deflation for the 2012–17 period is 0 percent, where it has been most days since early February this year. The 2013–18 deflation probability, based on the 5-year TIPS issued last month and the 10-year TIPS issued in July 2008, is also 0 percent.
Prices of Treasury Inflation-Protected Securities (TIPS) with similar maturity dates can be used to measure probabilities of a net decline in the consumer price index over the five-year period starting in early 2013 or the five-year period starting in early 2012.
I plan on providing updates to this measure on a regular interval.
_________

I post various economic indicators and indices because I believe they should be carefully monitored.  However, as those familiar with this blog are aware, I do not necessarily agree with what they depict or imply.
_____

The Special Note summarizes my overall thoughts about our economic situation

SPX at 1626.67 this post is written

Zillow Q2 2013 Home Price Expectations Survey – Summary & Comments


On May 7, the Zillow Q2 2013 Home Price Expectations Survey (pdf) results were released.  This survey is done on a quarterly basis.

An excerpt from the Press Release:
The survey of 105 economists, real estate experts and investment and market strategists was sponsored by leading real estate information marketplace Zillow, Inc. (NASDAQ: Z) and is conducted quarterly by Pulsenomics LLC. Panelists said they expected median U.S. home values to rise to $165,280, on average, by the end of 2013. At the end of 2012, the U.S. Zillow Home Value Index stood at $156,800.
Various charts from the March 2013 Survey results are presented, including the following:

(click on chart to enlarge image)

ZHPES Q2 2013 chart 5-7-13

As one can see from the above chart, the average expectation is that the residential real estate market, as depicted by the U.S. Zillow Home Value Index Level, will continually climb.

The detail of the Q2 2013 Home Price Expectations Survey (pdf) is interesting.  Of the 105 survey respondents, only 3 (of the displayed responses) forecast a cumulative price decrease through 2017; and of those 3, none foresee a double-digit percentage cumulative price drop.  The most “bearish” of these forecasts is that of Gary Shilling's prediction of a 5.05% cumulative price decrease through 2017.
The Median Cumulative Home Price Appreciation for years 2013-2017 is seen as 5.26%, 10.25%, 14.04%, 17.95% and 22.20%, respectively.

For a variety of reasons, I continue to believe that even the most “bearish” of these forecasts (as seen in Gary Shilling's above-referenced forecast)  will prove too optimistic in hindsight.  From a longer-term historical perspective, such a decline is rather tame in light of the wild excesses that occurred over the “bubble” years.

I have written extensively about the residential real estate situation.  For a variety of reasons, it is exceedingly complex.  While many people continue to have an optimistic view regarding future residential real estate prices, in my opinion such a view is unsupported on an “all things considered” basis.  Furthermore, (even) from these price levels there exists outsized potential for a price decline of severe magnitude, unfortunately.  I discussed this downside, based upon historical price activity, in the October 24, 2010 post titled “What’s Ahead For The Housing Market – A Look At The Charts.”
_____

The Special Note summarizes my overall thoughts about our economic situation

SPX at 1632.69 as this post is written

Wednesday, May 8, 2013

May 7 Gallup Poll Results On Economic Confidence – Notable Excerpts

On May 7, Gallup released the poll results titled “Americans' Confidence in the Economy Ties Record High.”  The subtitle is “Upper-income Americans confidence in April is out of negative territory.”

An excerpt:
Gallup's Economic Confidence Index last week matched the five-year weekly high and included the best three-day rolling average since Gallup began Daily tracking in 2008. Economic confidence in April also tied the five-year monthly best, and upper-income Americans' monthly confidence left negative territory for the first time in five years.
Here is the accompanying chart depicting monthly economic confidence:

Gallup 5-7-13 - U.S. Economic Confidence Index - Monthly Averages


_____

The Special Note summarizes my overall thoughts about our economic situation

SPX at 1625.96 as this post is written

Tuesday, May 7, 2013

Food Stamps As Of May 7, 2013


This post is an update to previous posts concerning food stamps.  The program is officially called “Supplemental Nutrition Assistance Program,” or SNAP.  As stated on the SNAP website, “As of Oct. 1, 2008, Supplemental Nutrition Assistance Program (SNAP) is the new name for the federal Food Stamp Program.”

The data was last updated April 5, 2013, reflecting January 2013 levels.

Here is a table showing various monthly statistics with regard to national participation and costs going back to FY2011.  As seen in this table, the number of people participating as of January 2013 is 47,772,108 up 2.85% from year-ago (January 2012) levels.  As a reference point, the figure as of June 2009 (the official end of the recession as defined by the NBER) was 34,882,031.  Longer-term annual data is also available.

As I wrote in the April 12, 2010 post, “Of course, what is particularly disconcerting is not only the extent of participation in these programs, but the fact that this is yet another notable statistic that is getting worse well after the purported end of the recession.”
_____

The Special Note summarizes my overall thoughts about our economic situation

SPX at 1617.50 as this post is written

Building Financial Danger – May 7, 2013 Update


On October 17, 2011 I wrote a post titled “Danger Signs In The Stock Market, Financial System And Economy.”  This post is a brief 24th update to that post.

My overall analysis indicates a continuing elevated and growing level of danger which contains  many worldwide and U.S.-specific “stresses” of a very complex nature. I have written numerous posts in this blog of some of what I consider both ongoing and recent “negative developments.”  These developments, as well as other exceedingly problematic conditions, have presented a highly perilous economic environment that endangers the overall financial system.

Also of ongoing immense importance is the existence of various immensely large asset bubbles, a subject of which I have extensively written.  While all of these asset bubbles are wildly pernicious and will have profound adverse future implications, hazards presented by the bond market bubble are especially notable.

Predicting the specific timing and extent of a stock market crash is always difficult, and the immense complexity of today’s economic situation makes such a prediction even more challenging. With that being said, my analyses indicate that the danger inherent in the financial system has surpassed the level at which a near-term stock market crash – that would also involve (as seen in 2008) various other markets as well – is of tremendous concern.

(note: the “next crash” has outsized significance and implications, as discussed in the post of January 6, 2012 titled "The Next Crash And Its Significance")

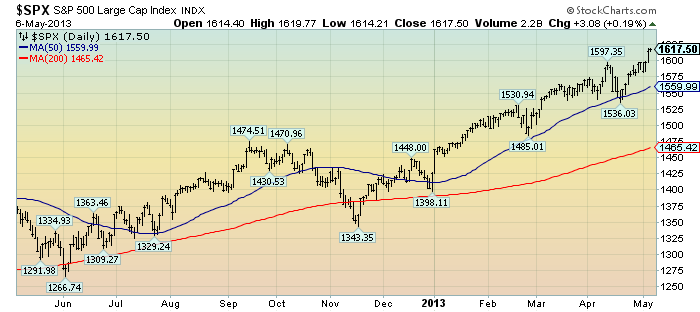
As reference, below is a one-year daily chart of the S&P500 through May 6 (with a closing price of 1617.50), indicating both the 50dma and 200dma as well as price labels:

(click on chart to enlarge image)(chart courtesy of StockCharts.com; chart creation and annotation by the author)

EconomicGreenfield 5-7-13 SPX 1-year daily

_____

The Special Note summarizes my overall thoughts about our economic situation

SPX at 1617.50 as this post is written

Monday, May 6, 2013

Recession Probability Models


There are a variety of economic models that are supposed to predict the probabilities of recession.

While I don’t agree with the methodologies employed or probabilities of impending economic weakness as depicted by the following two models, I think the results of these models should be monitored.

Please note that each of these models is updated regularly, and the results of these – as well as other recession models – can fluctuate significantly.

The first is the “Yield Curve as a Leading Indicator” from the New York Federal Reserve.  I wrote a blog post concerning this measure on March 1, 2010, titled “The Yield Curve as a Leading Indicator.”

Currently (last updated May 3, using data through April) this “Yield Curve” model shows a 5.38% probability of a recession in the United States twelve months ahead.  For comparison purposes, it showed a 4.31% probability through March.

The second model is from Marcelle Chauvet and Jeremy Piger.  This model is described on the St. Louis Federal Reserve site (FRED) as follows:
Smoothed recession probabilities for the United States are obtained from a dynamic-factor markov-switching model applied to four monthly coincident variables: non-farm payroll employment, the index of industrial production, real personal income excluding transfer payments, and real manufacturing and trade sales. This model was originally developed in Chauvet, M., “An Economic Characterization of Business Cycle Dynamics with Factor Structure and Regime Switching,” International Economic Review, 1998, 39, 969-996. (http://faculty.ucr.edu/~chauvet/ier.pdf)
Additional details and explanations can be seen on the “U.S. Recession Probabilities” page.

This model, last updated on May 1, 2013, currently shows a .22% probability using data through February.

Here is the FRED chart (last updated May 1) :

RECPROUSM156N_5-1-13 .22 percent
Data Source: FRED, Federal Reserve Economic Data, Federal Reserve Bank of St. Louis: Marcelle Chauvet and Jeremy Piger; U.S. Recession Probabilities [RECPROUSM156N]; accessed May 6, 2013:

-

The two models featured above can be compared against measures seen in recent blog posts.  For instance, as seen in the April 13 post titled “The April 2013 Wall Street Journal Economic Forecast Survey" economists surveyed averaged a 15% probability of a U.S. recession within the next 12 months.

Of course, there is a (very) limited number of prominent parties, such as ECRI (most recently featured in the May 3 post titled "Long-Term Charts Of The ECRI WLI & ECRI WLI,Gr. – May 3, 2013 Update") that believe the U.S. is currently experiencing a recession.
_____

The Special Note summarizes my overall thoughts about our economic situation

SPX at 1617.21 as this post is written