Wednesday, January 29, 2014

The State of the Union Address – Notable Excerpts

I found President Obama’s State of the Union Address (transcript from the Wall Street Journal) last night to contain some noteworthy comments.  While I could comment extensively on many parts of the speech, for now I will indicate excerpts that I found most relevant with regard to the economic situation, and may comment upon them at a future point.  I am highlighting these excerpts for many reasons; it should be noted that I do not necessarily agree with all of them.
Here are the excerpts I found most relevant, in the order they occurred in the speech:
Let’s face it:  That belief has suffered some serious blows. Over more than three decades, even before the Great Recession hit, massive shifts in technology and global competition had eliminated a lot of good, middle-class jobs, and weakened the economic foundations that families depend on.
Today, after four years of economic growth, corporate profits and stock prices have rarely been higher, and those at the top have never done better.  But average wages have barely budged.  Inequality has deepened.  Upward mobility has stalled.  The cold, hard fact is that even in the midst of recovery, too many Americans are working more than ever just to get by, let alone to get ahead.  And too many still aren’t working at all.
also:
Opportunity is who we are.  And the defining project of our generation must be to restore that promise.  We know where to start:  The best measure of opportunity is access to a good job. With the economy picking up speed, companies say they intend to hire more people this year.  And over half of big manufacturers say they’re thinking of insourcing jobs from abroad.  (Applause.)
also:
The ideas I’ve outlined so far can speed up growth and create more jobs.  But in this rapidly changing economy, we have to make sure that every American has the skills to fill those jobs.  The good news is we know how to do it.
_____
The Special Note summarizes my overall thoughts about our economic situation
SPX at 1792.50 as this post is written

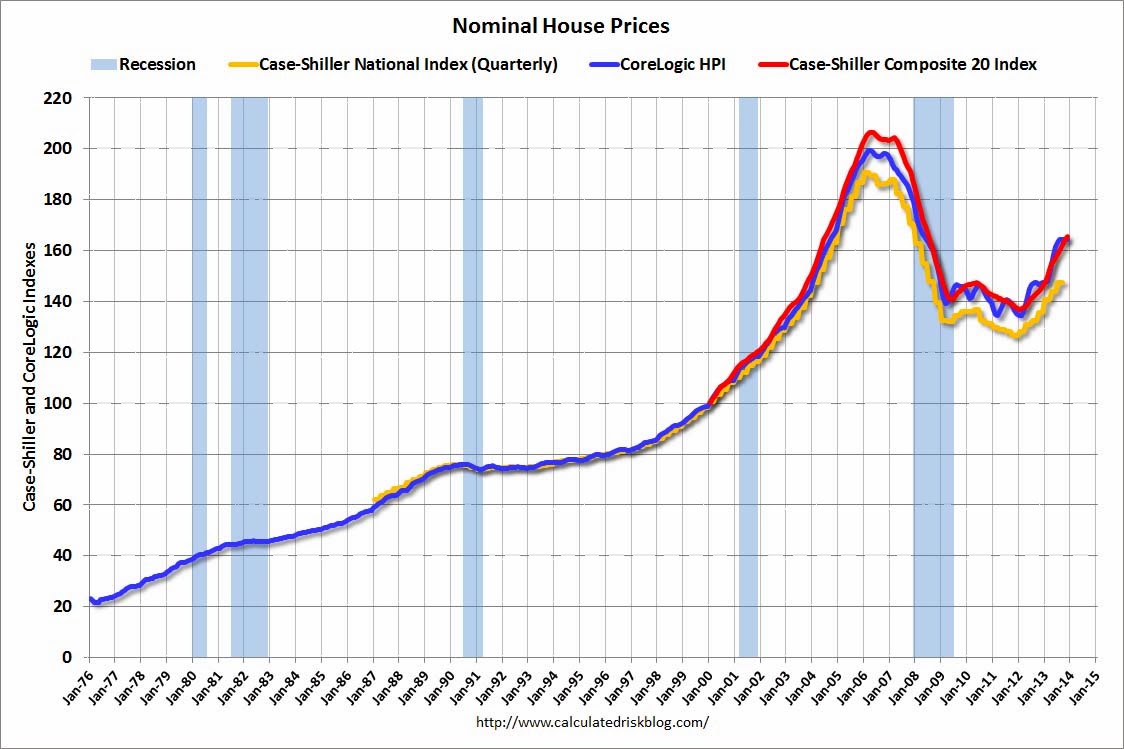
House Prices Reference Chart

As a reference for long-term house price index trends, below is a chart, updated with the most current data (through November, except for the Case-Shiller National Index, which is through September), from the CalculatedRisk blog post of January 28 titled “Comment on House Prices: Real Prices, Price-to-Rent Ratio, Cities” :
(click on chart to enlarge image)
CR 1-28-14 - NominalHPNov2013

_____
The Special Note summarizes my overall thoughts about our economic situation
SPX at 1792.50 as this post is written
Tuesday, January 28, 2014

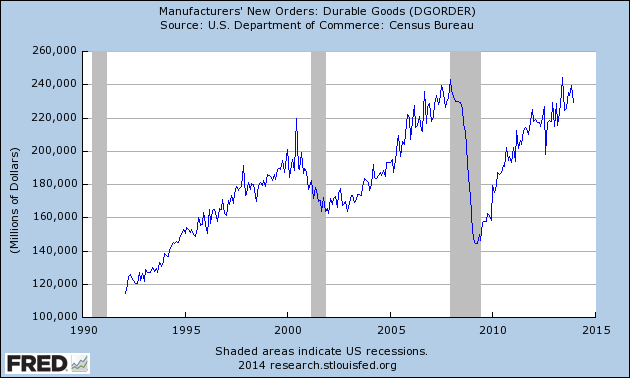
Durable Goods New Orders – Long-Term Charts Through December 2013

Many people place emphasis on Durable Goods New Orders as a prominent economic indicator and/or leading economic indicator.
For reference, below are charts depicting this measure.
First, from the St. Louis Fed site (FRED), a chart through December, last updated on January 28.  This value is 229,319 ($ Millions) :
(click on charts to enlarge images)
DGORDER_1-28-14 229319
-
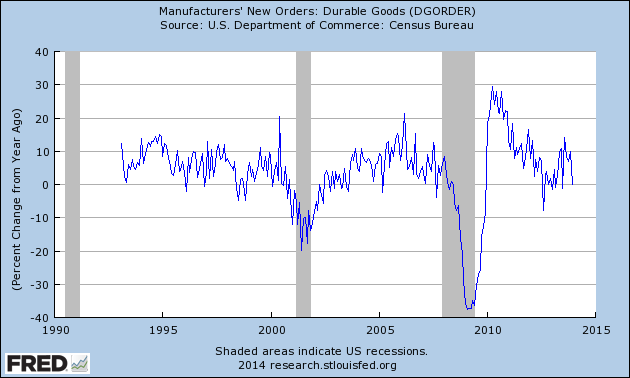
Here is the chart depicting this measure on a “Percentage Change from a Year Ago” basis:
DGORDER_1-28-14 229319 Percent Change From Year Ago
Data Source: FRED, Federal Reserve Economic Data, Federal Reserve Bank of St. Louis: Manufacturers’ New Orders:  Durable Goods [DGORDER] ; U.S. Department of Commerce: Census Bureau ; accessed January 28, 2014;
_________
I post various indicators and indices because I believe they should be carefully monitored.  However, as those familiar with this blog are aware, I do not necessarily agree with what they depict or imply.
_____
The Special Note summarizes my overall thoughts about our economic situation
SPX at 1793.34 as this post is written

VIX Monthly And Weekly Charts Since Year 2000

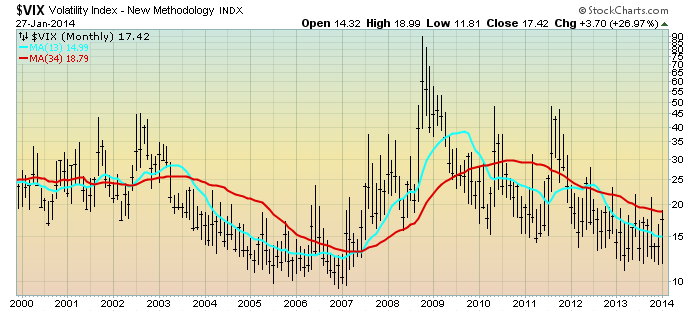
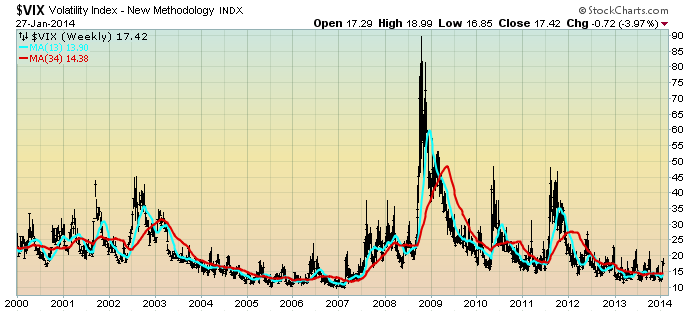
For reference purposes, below are two charts of the VIX from year 2000 through yesterday's (January 27, 2014) close.
Here is the VIX Monthly chart, depicted on a LOG scale, with price labels as well as the 13- and 34-month moving averages, seen in the cyan and red lines, respectively:
(click on chart to enlarge image)(chart courtesy of StockCharts.com; chart creation and annotation by the author)
EconomicGreenfield 1-28-14 VIX Monthly LOG Since 2000
-
Here is the VIX Weekly chart, depicted on a LOG scale, with price labels as well as the 13- and 34-week moving average, seen in the cyan and red lines, respectively:
(click on chart to enlarge image)(chart courtesy of StockCharts.com; chart creation and annotation by the author)
EconomicGreenfield 1-28-14 VIX Weekly LOG Since 2000

_____
The Special Note summarizes my overall thoughts about our economic situation
SPX at 1781.56 as this post is written

Monday, January 27, 2014

Trends Of S&P500 Earnings Forecasts

S&P500 earnings trends and estimates are a notably important topic, for a variety of reasons, at this point in time.
FactSet publishes a report titled “Earnings Insight” that contains a variety of information including the trends and expectations of S&P500 earnings.
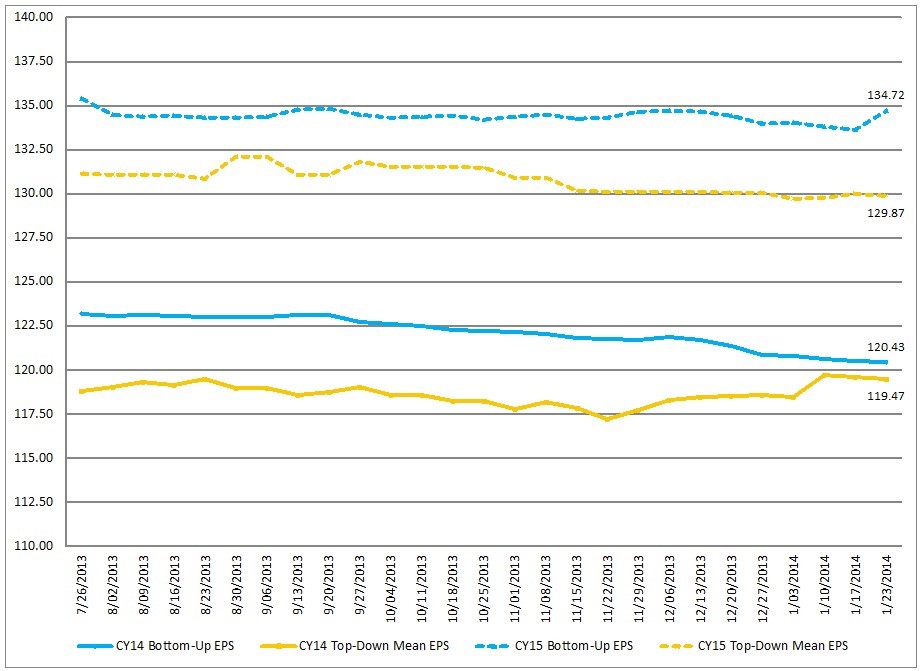
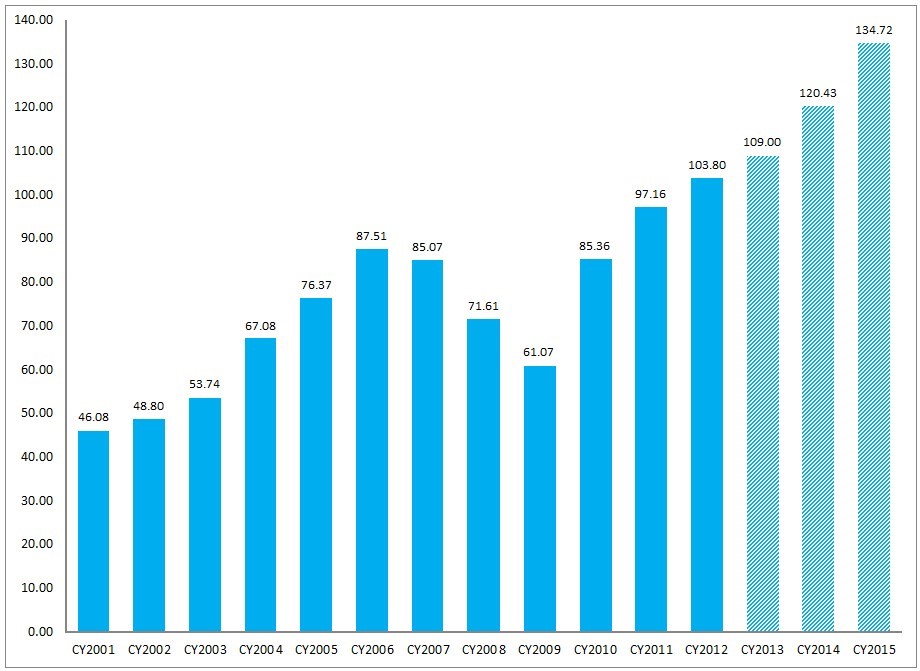
For reference purposes, here are two charts as seen in the “Earnings Insight” (pdf) report of January 24, 2014:
from page 17:
(click on charts to enlarge images)
CY Bottom-Up EPS vs. Top-Down Mean EPS (Trailing 26-Weeks) 
FactSet Earnings Insight 1-24-14 CY2014 and CY2015
-
from page 18:
Calendar Year Bottom-Up EPS Actuals & Estimates
FactSet Earnings Insight 1-24-14 CY2001-CY2015

_____
I post various economic forecasts because I believe they should be carefully monitored.  However, as those familiar with this blog are aware, I do not agree with many of the consensus estimates and much of the commentary in these forecast surveys.
_____
The Special Note summarizes my overall thoughts about our economic situation
SPX at 1783.42 as this post is written

S&P500 Earnings Estimates For Years 2013, 2014, And 2015

As many are aware, Thomson Reuters publishes earnings estimates for the S&P500.  (My other posts concerning S&P earnings estimates can be found under the S&P500 Earnings label)
The following estimates are from Exhibit 12 of “The Director’s Report” (pdf) of January 24, 2014, and represent an aggregation of individual S&P500 component “bottom up” analyst forecasts:
Year 2013 estimate:
$108.97/share
Year 2014 estimate:
$120.46/share
Year 2015 estimate:
$133.31/share
_____
I post various economic forecasts because I believe they should be carefully monitored.  However, as those familiar with this blog are aware, I do not agree with many of the consensus estimates and much of the commentary in these forecast surveys.
_____
The Special Note summarizes my overall thoughts about our economic situation
SPX at 1790.29 as this post is written

Friday, January 24, 2014

Standard & Poor’s S&P500 Earnings Estimates For 2013 & 2014 – As Of January 16, 2014

As many are aware, Standard & Poor’s publishes earnings estimates for the S&P500.  (My posts concerning their estimates can be found under the S&P500 Earnings label)
For reference purposes, the most current estimates are reflected below, and are as of January 16, 2014:
Year 2013 estimates add to the following:
-From a “bottom up” perspective, operating earnings of $107.38/share
-From a “top down” perspective, operating earnings of N/A
-From a “top down” perspective, “as reported” earnings of $99.42/share
Year 2014 estimates add to the following:
-From a “bottom up” perspective, operating earnings of $121.30/share
-From a “top down” perspective, operating earnings of $123.63/share
-From a “top down” perspective, “as reported” earnings of $119.70/share
_____
I post various economic forecasts because I believe they should be carefully monitored.  However, as those familiar with this blog are aware, I do not agree with many of the consensus estimates and much of the commentary in these forecast surveys.
_____
The Special Note summarizes my overall thoughts about our economic situation
SPX at 1794.28 as this post is written

Long-Term Charts Of The ECRI WLI & ECRI WLI, Gr. – January 24, 2014 Update

As I stated in my July 12, 2010 post (“ECRI WLI Growth History“):
For a variety of reasons, I am not as enamored with ECRI’s WLI and WLI Growth measures as many are.
However, I do think the measures are important and deserve close monitoring and scrutiny.
The movement of the ECRI WLI and WLI, Gr. is particularly notable at this time, as ECRI publicly announced on September 30, 2011 that the U.S. was “tipping into recession,” and ECRI has reiterated the view that the U.S. economy is currently in a recession, seen most recently in these twelve sources :
Other past notable year 2012 reaffirmations of the September 30, 2011 recession call by ECRI were seen (in chronological order) on March 15 (“Why Our Recession Call Stands”) as well as various interviews and statements the week of May 6, including:
Also, subsequent to May 2012:
__
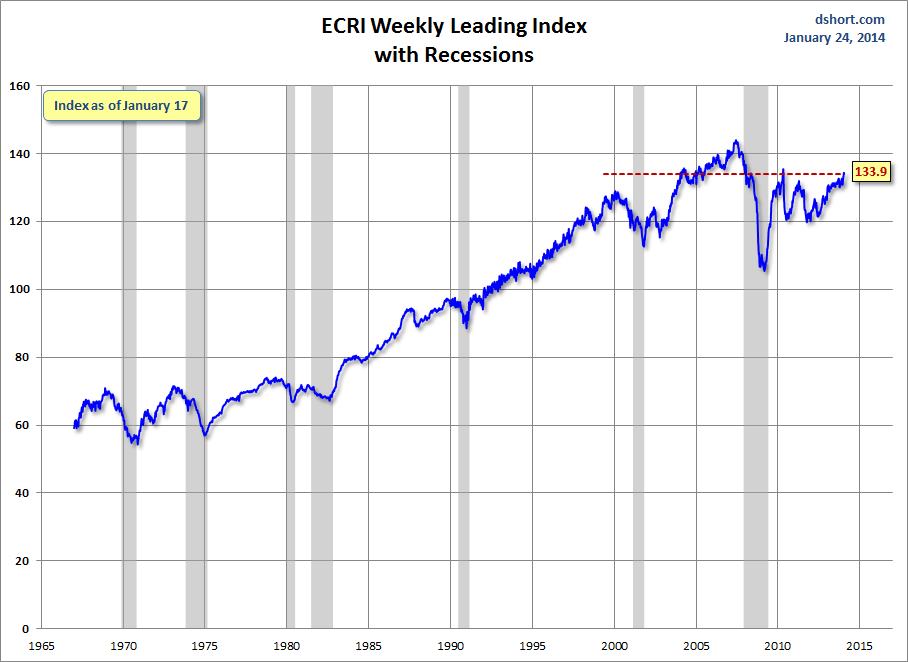
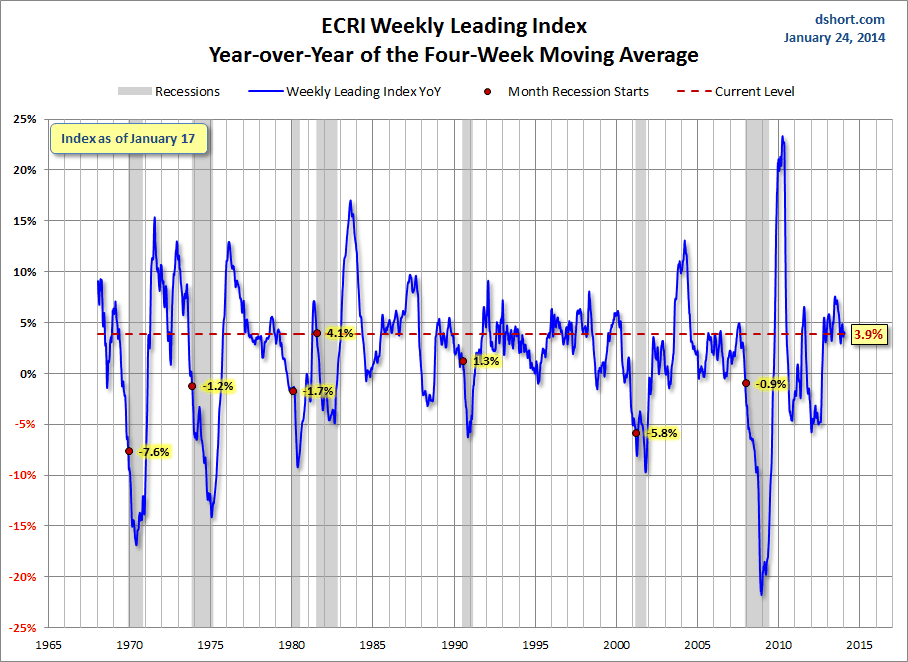
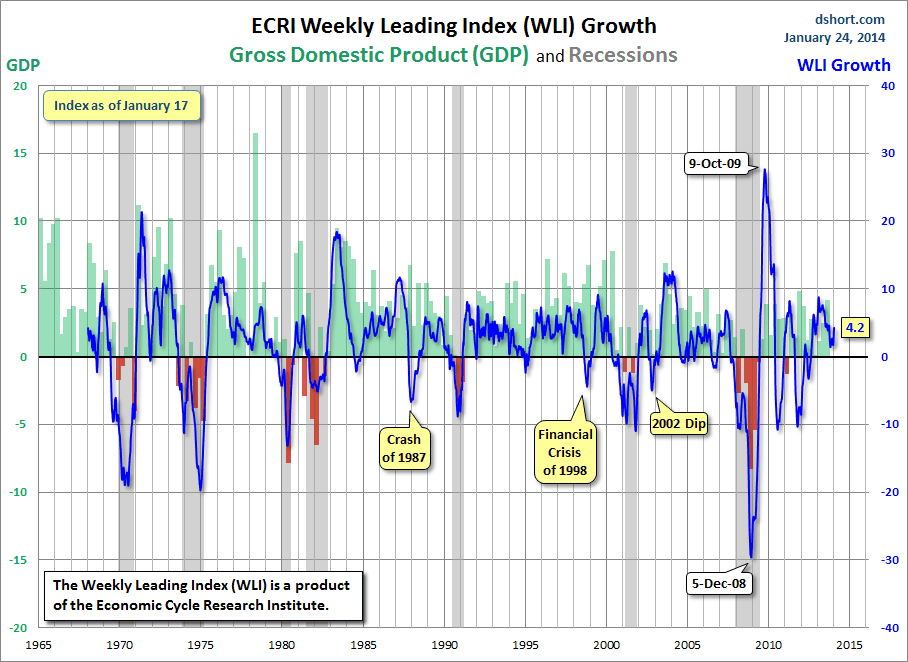
Below are three long-term charts, from Doug Short’s blog post of January 24, 2014 titled “ECRI Recession Watch:  Weekly Update.”  These charts are on a weekly basis through the January 24 release, indicating data through January 17, 2014.
Here is the ECRI WLI (defined at ECRI’s glossary):
Dshort 1-24-14 - ECRI-WLI 133.9
-
This next chart depicts, on a long-term basis, the Year-over-Year change in the 4-week moving average of the WLI:
Dshort 1-24-14 - ECRI-WLI-YoY 3.9 percent
-
This last chart depicts, on a long-term basis, the WLI, Gr.:
Dshort 1-24-14 - ECRI-WLI-growth-since-1965 4.2
_________
I post various economic indicators and indices because I believe they should be carefully monitored.  However, as those familiar with this blog are aware, I do not necessarily agree with what they depict or imply.
_____
The Special Note summarizes my overall thoughts about our economic situation
SPX at 1799.18 as this post is written