Friday, January 9, 2015

Long-Term Charts Of The ECRI WLI & ECRI WLI, Gr. – January 9, 2015 Update

As I stated in my July 12, 2010 post (“ECRI WLI Growth History“):
For a variety of reasons, I am not as enamored with ECRI’s WLI and WLI Growth measures as many are.
However, I do think the measures are important and deserve close monitoring and scrutiny.
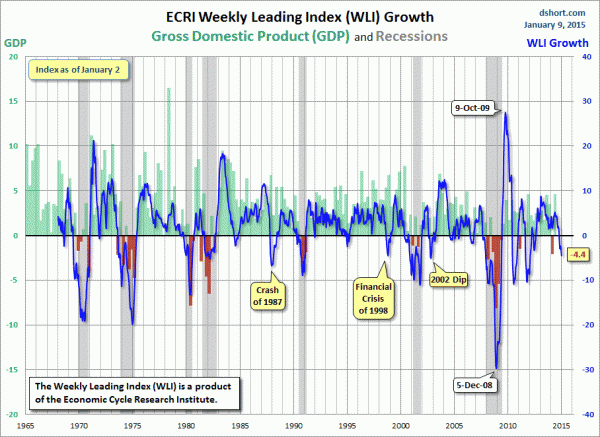
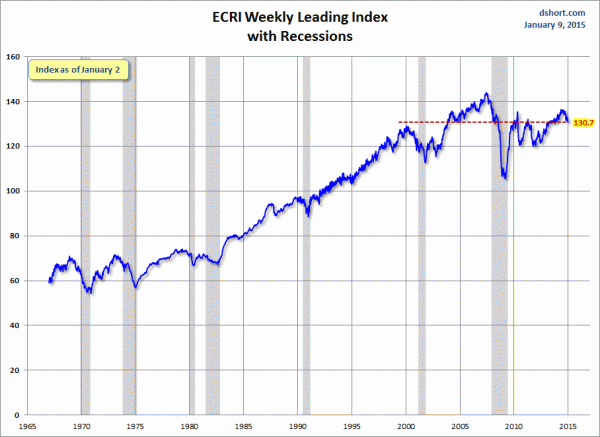
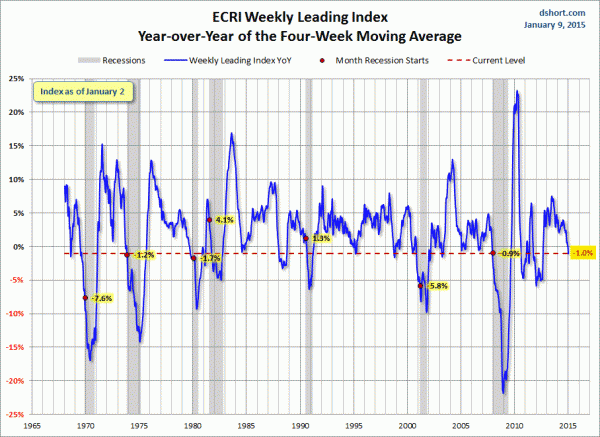
Below are three long-term charts, from Doug Short’s blog post of January 9, 2015 titled “ECRI Recession Watch:  Weekly Update.”  These charts are on a weekly basis through the January 9 release, indicating data through January 2, 2015.
Here is the ECRI WLI (defined at ECRI’s glossary):
ECRI WLI
This next chart depicts, on a long-term basis, the Year-over-Year change in the 4-week moving average of the WLI:
Dshort 1-9-15 - ECRI-WLI-YoY -1.0
This last chart depicts, on a long-term basis, the WLI, Gr.:
ECRI WLI
_________
I post various economic indicators and indices because I believe they should be carefully monitored.  However, as those familiar with this blog are aware, I do not necessarily agree with what they depict or imply.
_____
The Special Note summarizes my overall thoughts about our economic situation
SPX at 2047.57 as this post is written

U-3 And U-6 Unemployment Rate Long-Term Reference Charts As Of January 9, 2015

Shortly after each monthly employment report I have been posting a continual series titled “3 Critical Unemployment Charts.”
Of course, there are many other employment charts that can be displayed as well.
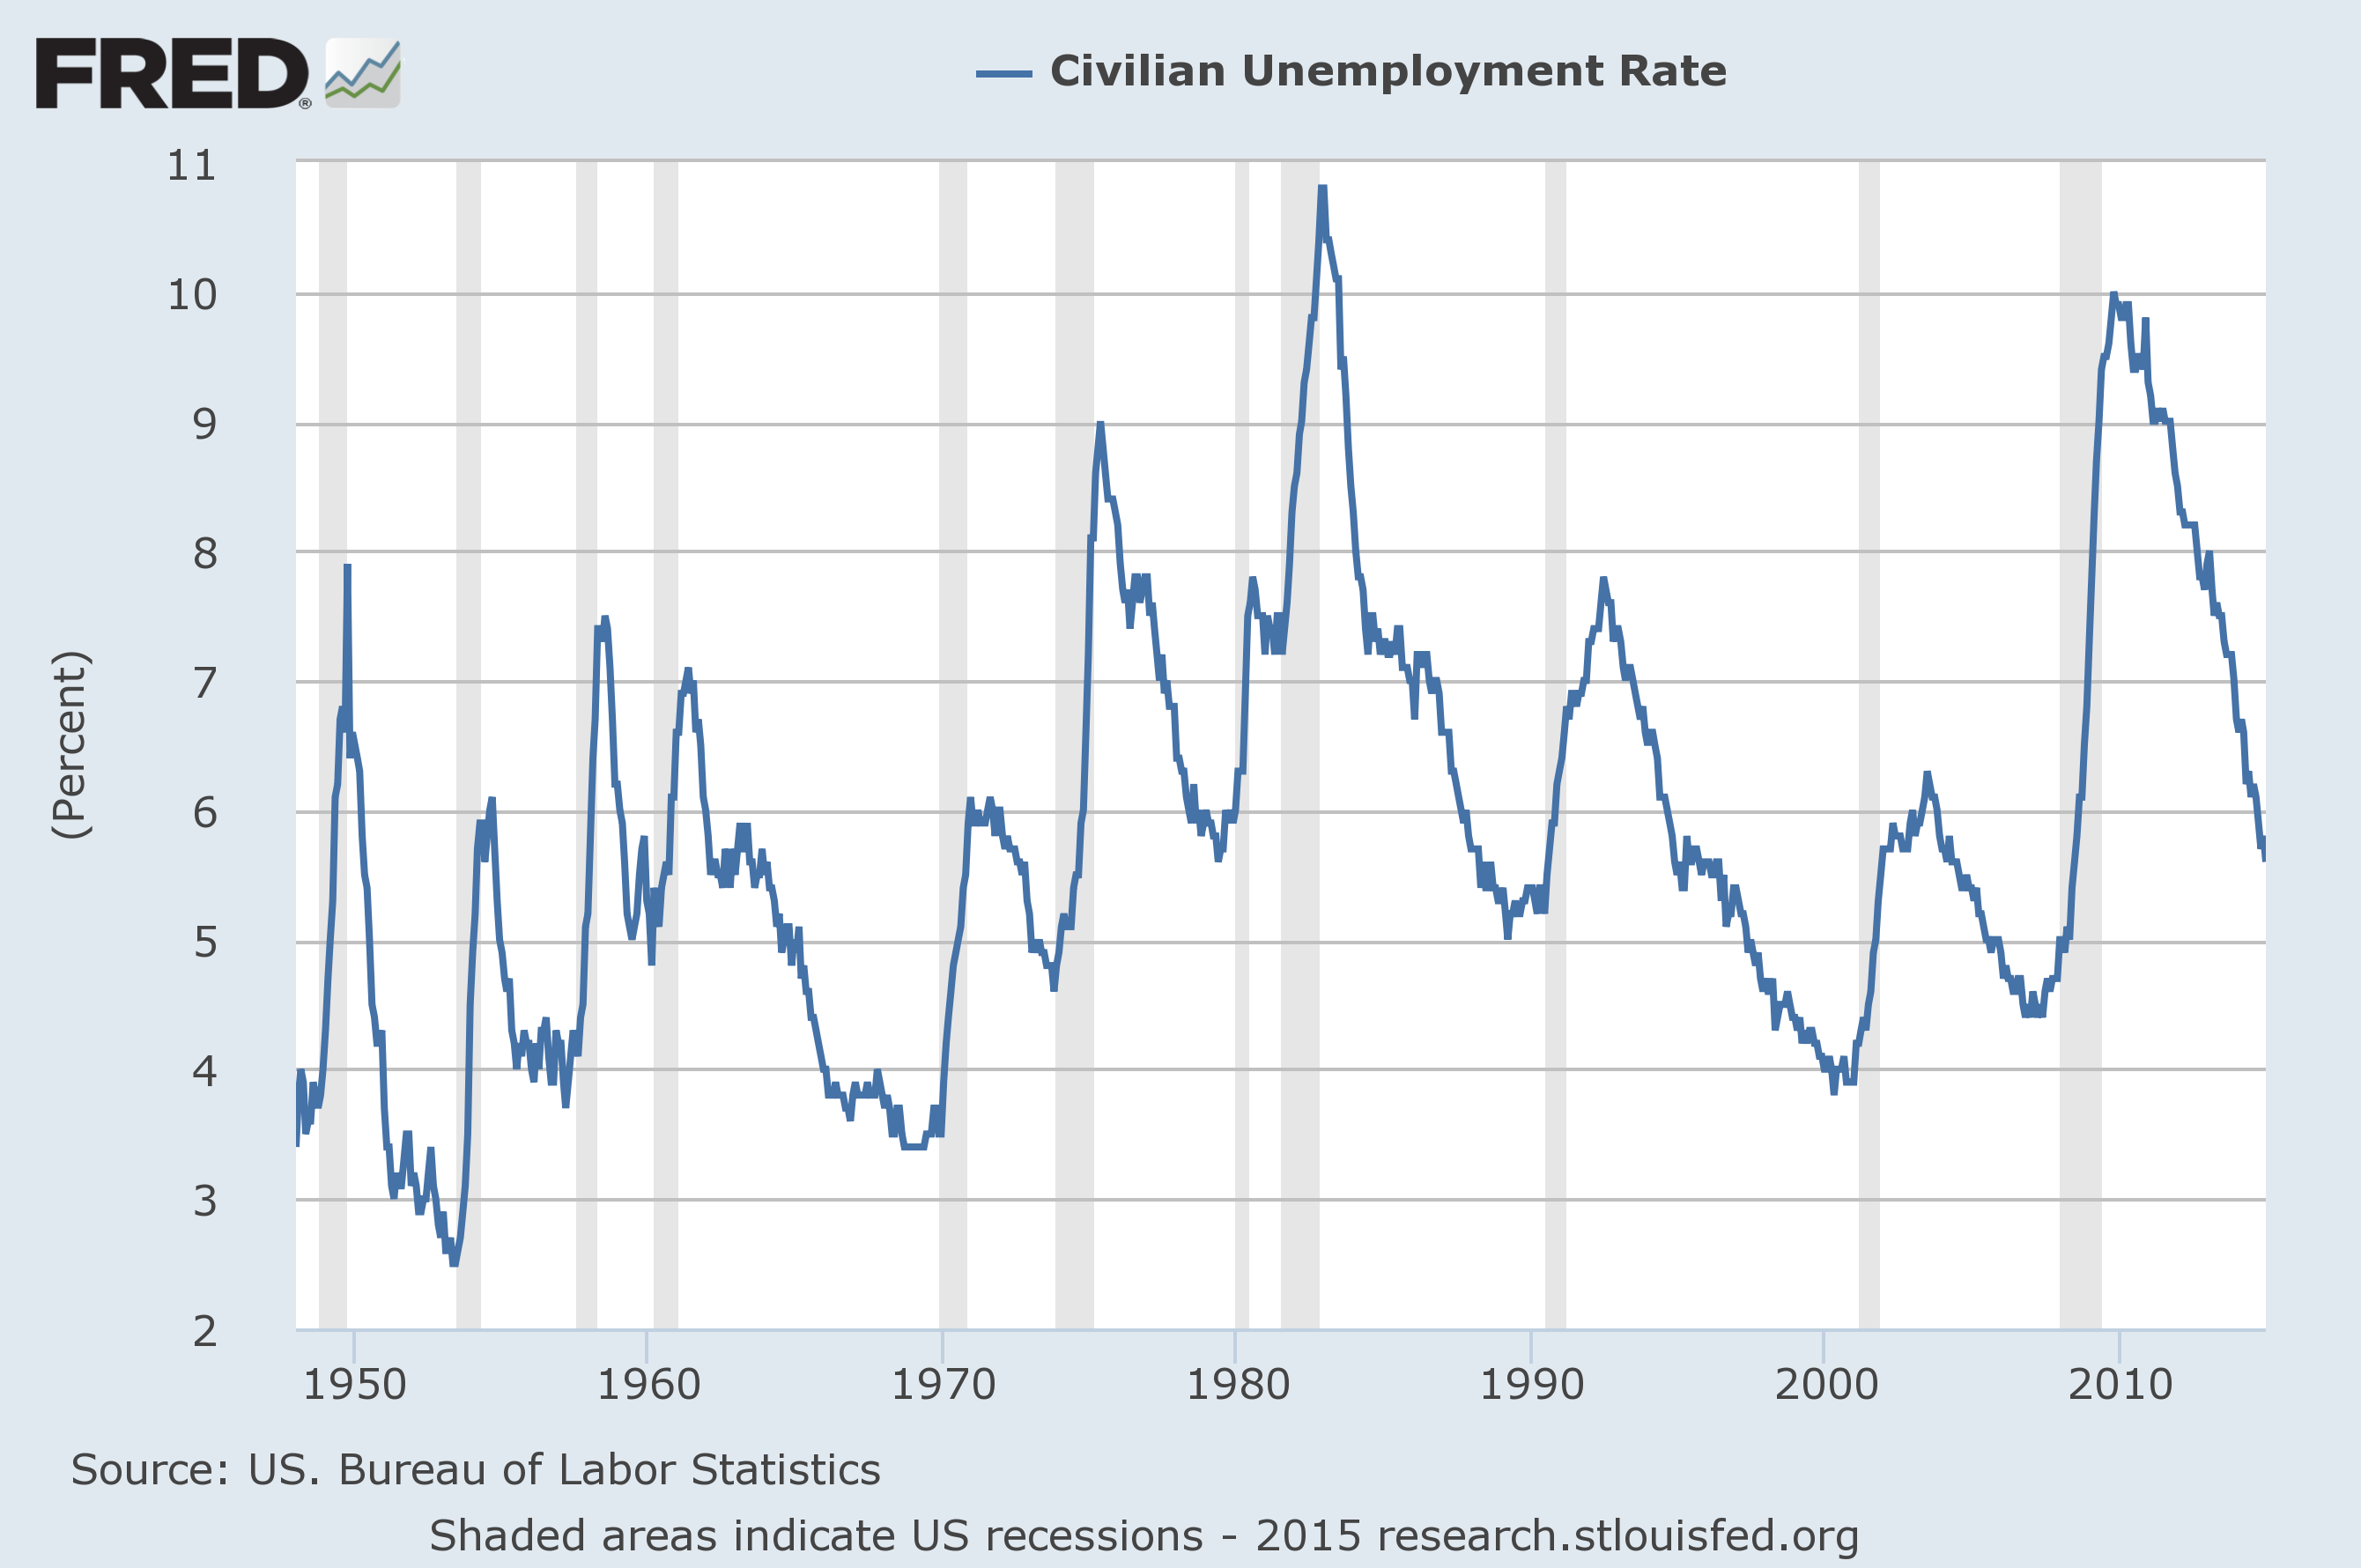
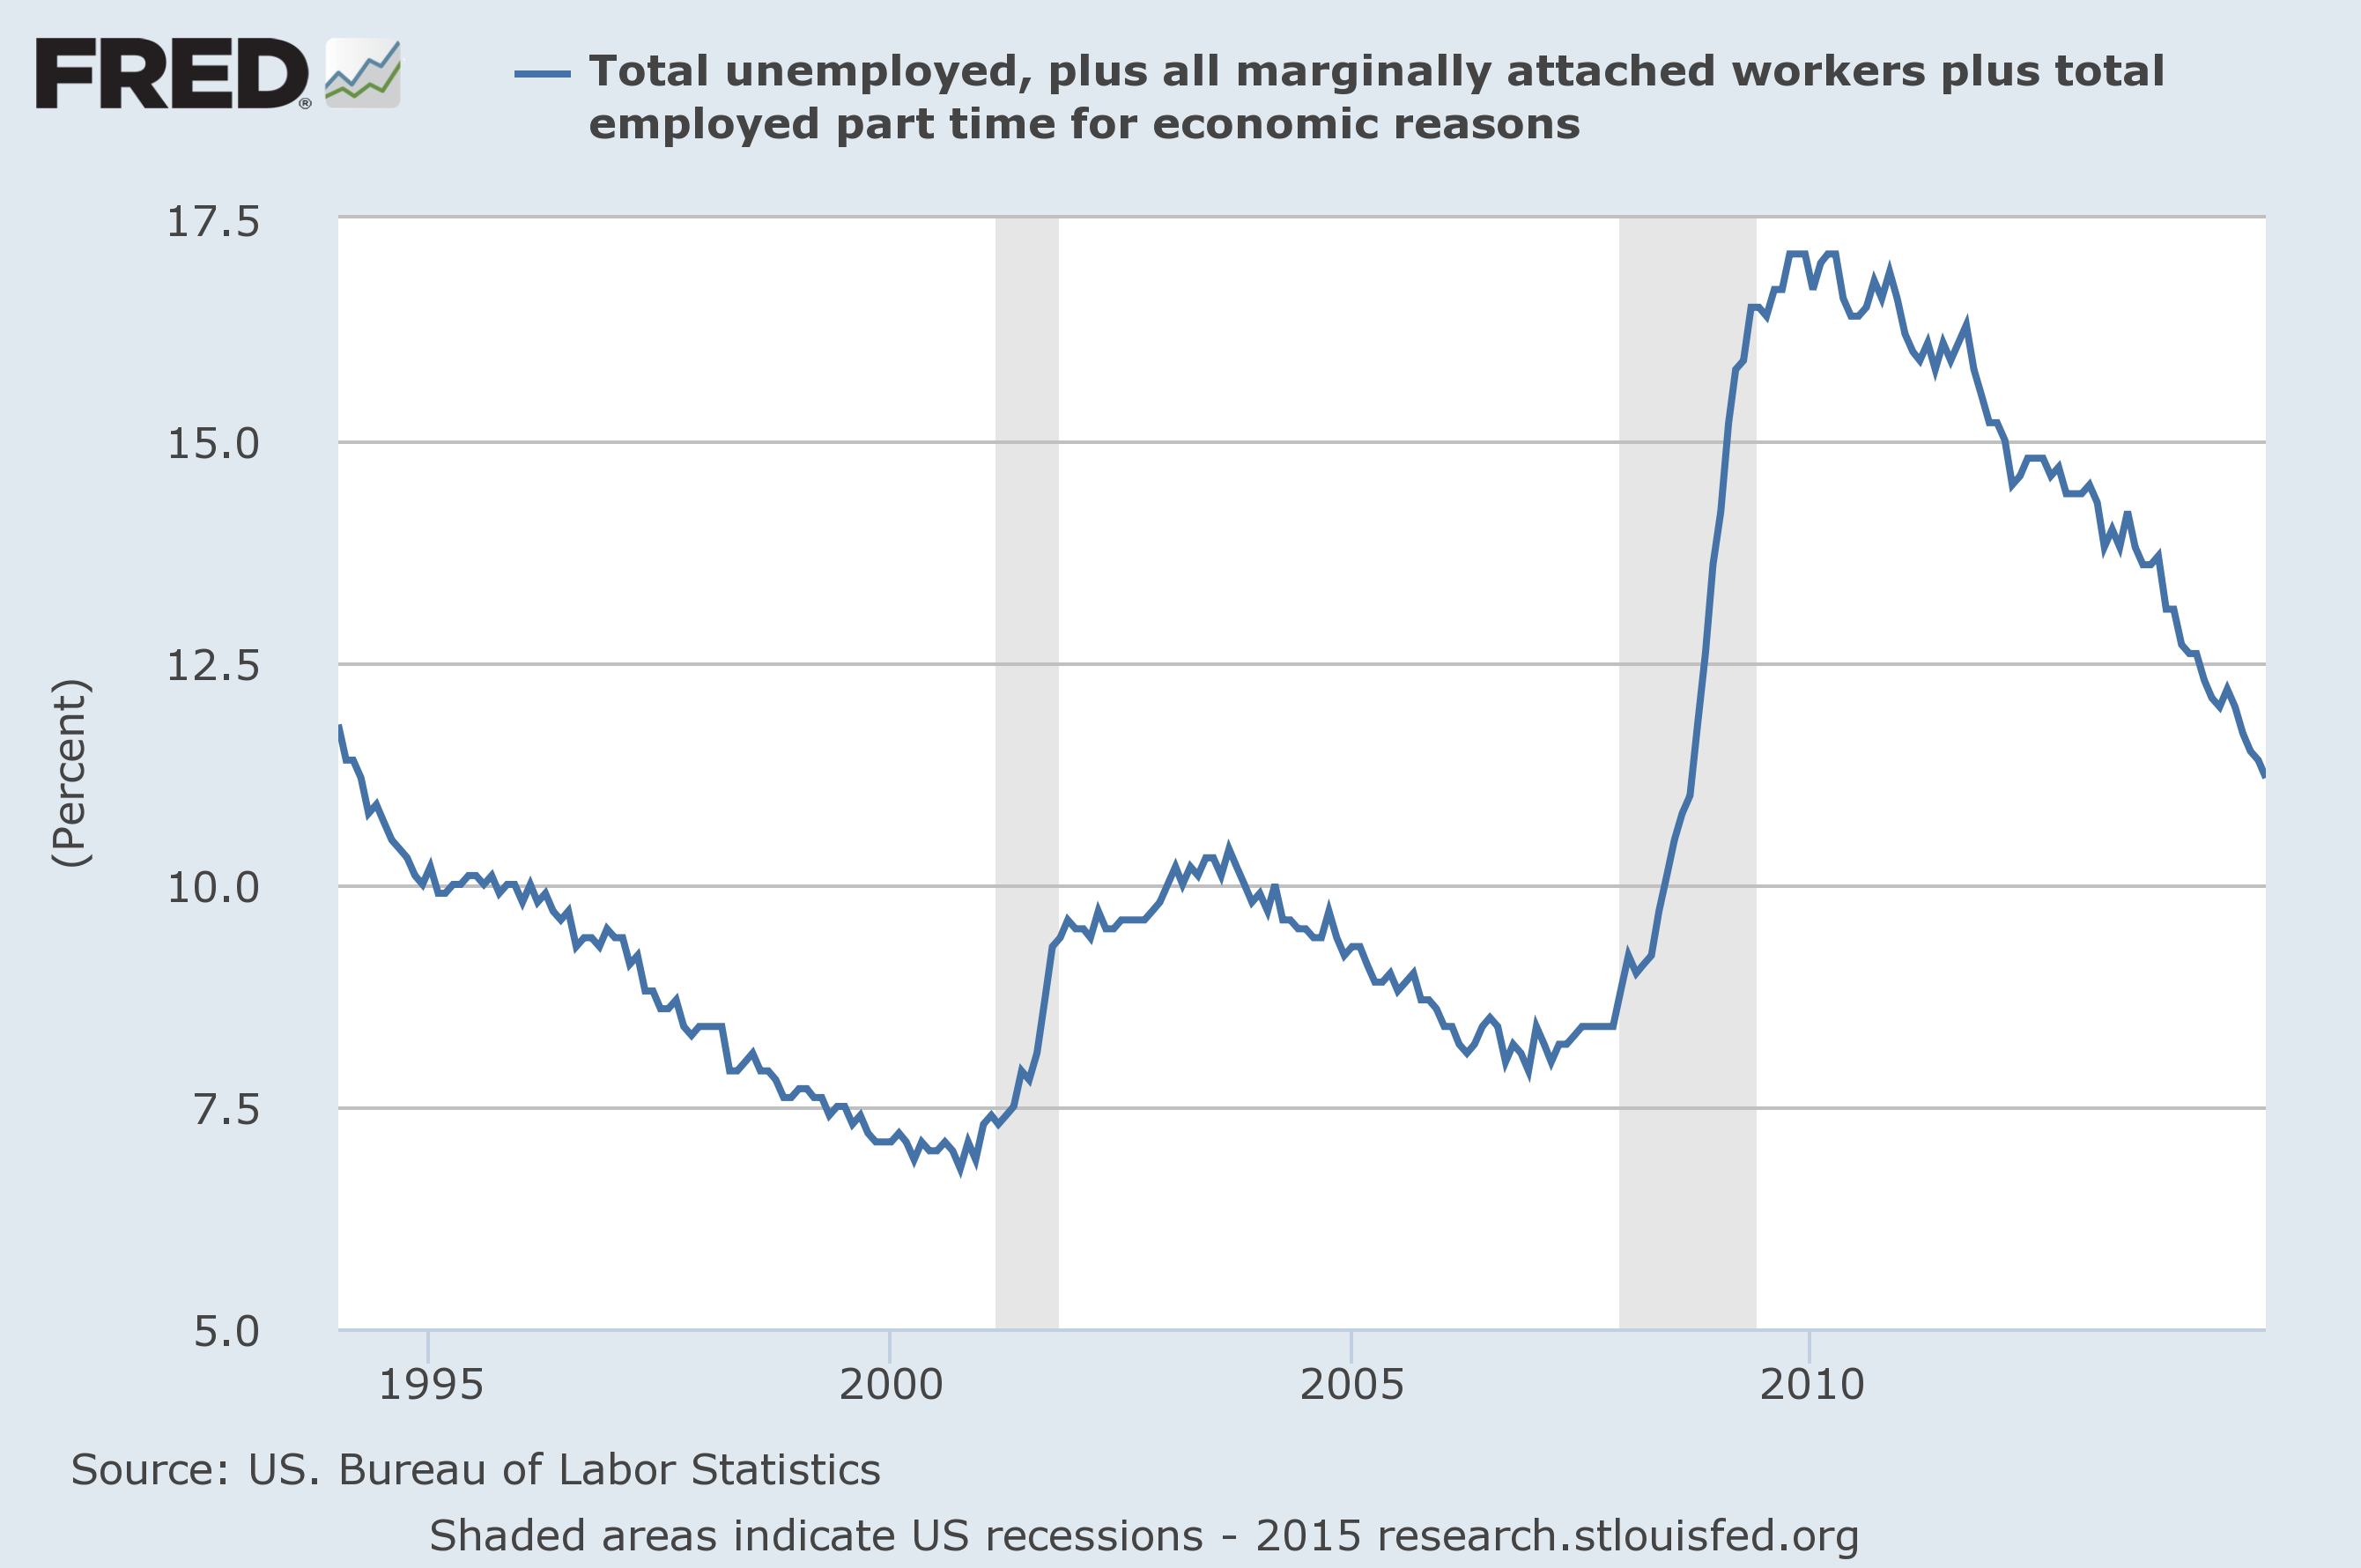
For reference purposes, below are the U-3 and U-6 Unemployment Rate charts from a long-term historical perspective.  Both charts are from the St. Louis Fed site.  The U-3 measure is what is commonly referred to as the official unemployment rate; whereas the U-6 rate is officially (per Bureau of Labor Statistics) defined as:
Total unemployed, plus all persons marginally attached to the labor force, plus total employed part time for economic reasons, as a percent of the civilian labor force plus all persons marginally attached to the labor force
Of note, many economic observers use the U-6 rate as a (closer) proxy of the actual unemployment rate rather than that depicted by the U-3 measure.
Here is the U-3 chart, currently showing a 5.6% unemployment rate:
(click on charts to enlarge images)(charts updated as of 1-9-15)
U-3 Rate
Data Source: FRED, Federal Reserve Economic Data, Federal Reserve Bank of St. Louis: Civilian Unemployment Rate [UNRATE] ; U.S. Department of Labor: Bureau of Labor Statistics; accessed January 9, 2015;
Here is the U-6 chart, currently showing a 11.2% unemployment rate:
U-6 rate
Data Source: FRED, Federal Reserve Economic Data, Federal Reserve Bank of St. Louis: Total unemployed, plus all marginally attached workers plus total employed part time for economic reasons  [U6RATE] ; U.S. Department of Labor: Bureau of Labor Statistics; accessed January 9, 2015;
_____
The Special Note summarizes my overall thoughts about our economic situation
SPX at 2044.40 as this post is written

3 Critical Unemployment Charts – January 2015

As I have commented previously, as in the October 6, 2009 post (“A Note About Unemployment Statistics”), in my opinion the official methodologies used to measure the various job loss and unemployment statistics do not provide an accurate depiction; they serve to understate the severity of unemployment.
However, even if one chooses to look at the official statistics, the following charts provide an interesting (and disconcerting) long-term perspective of certain aspects of the officially-stated unemployment situation.
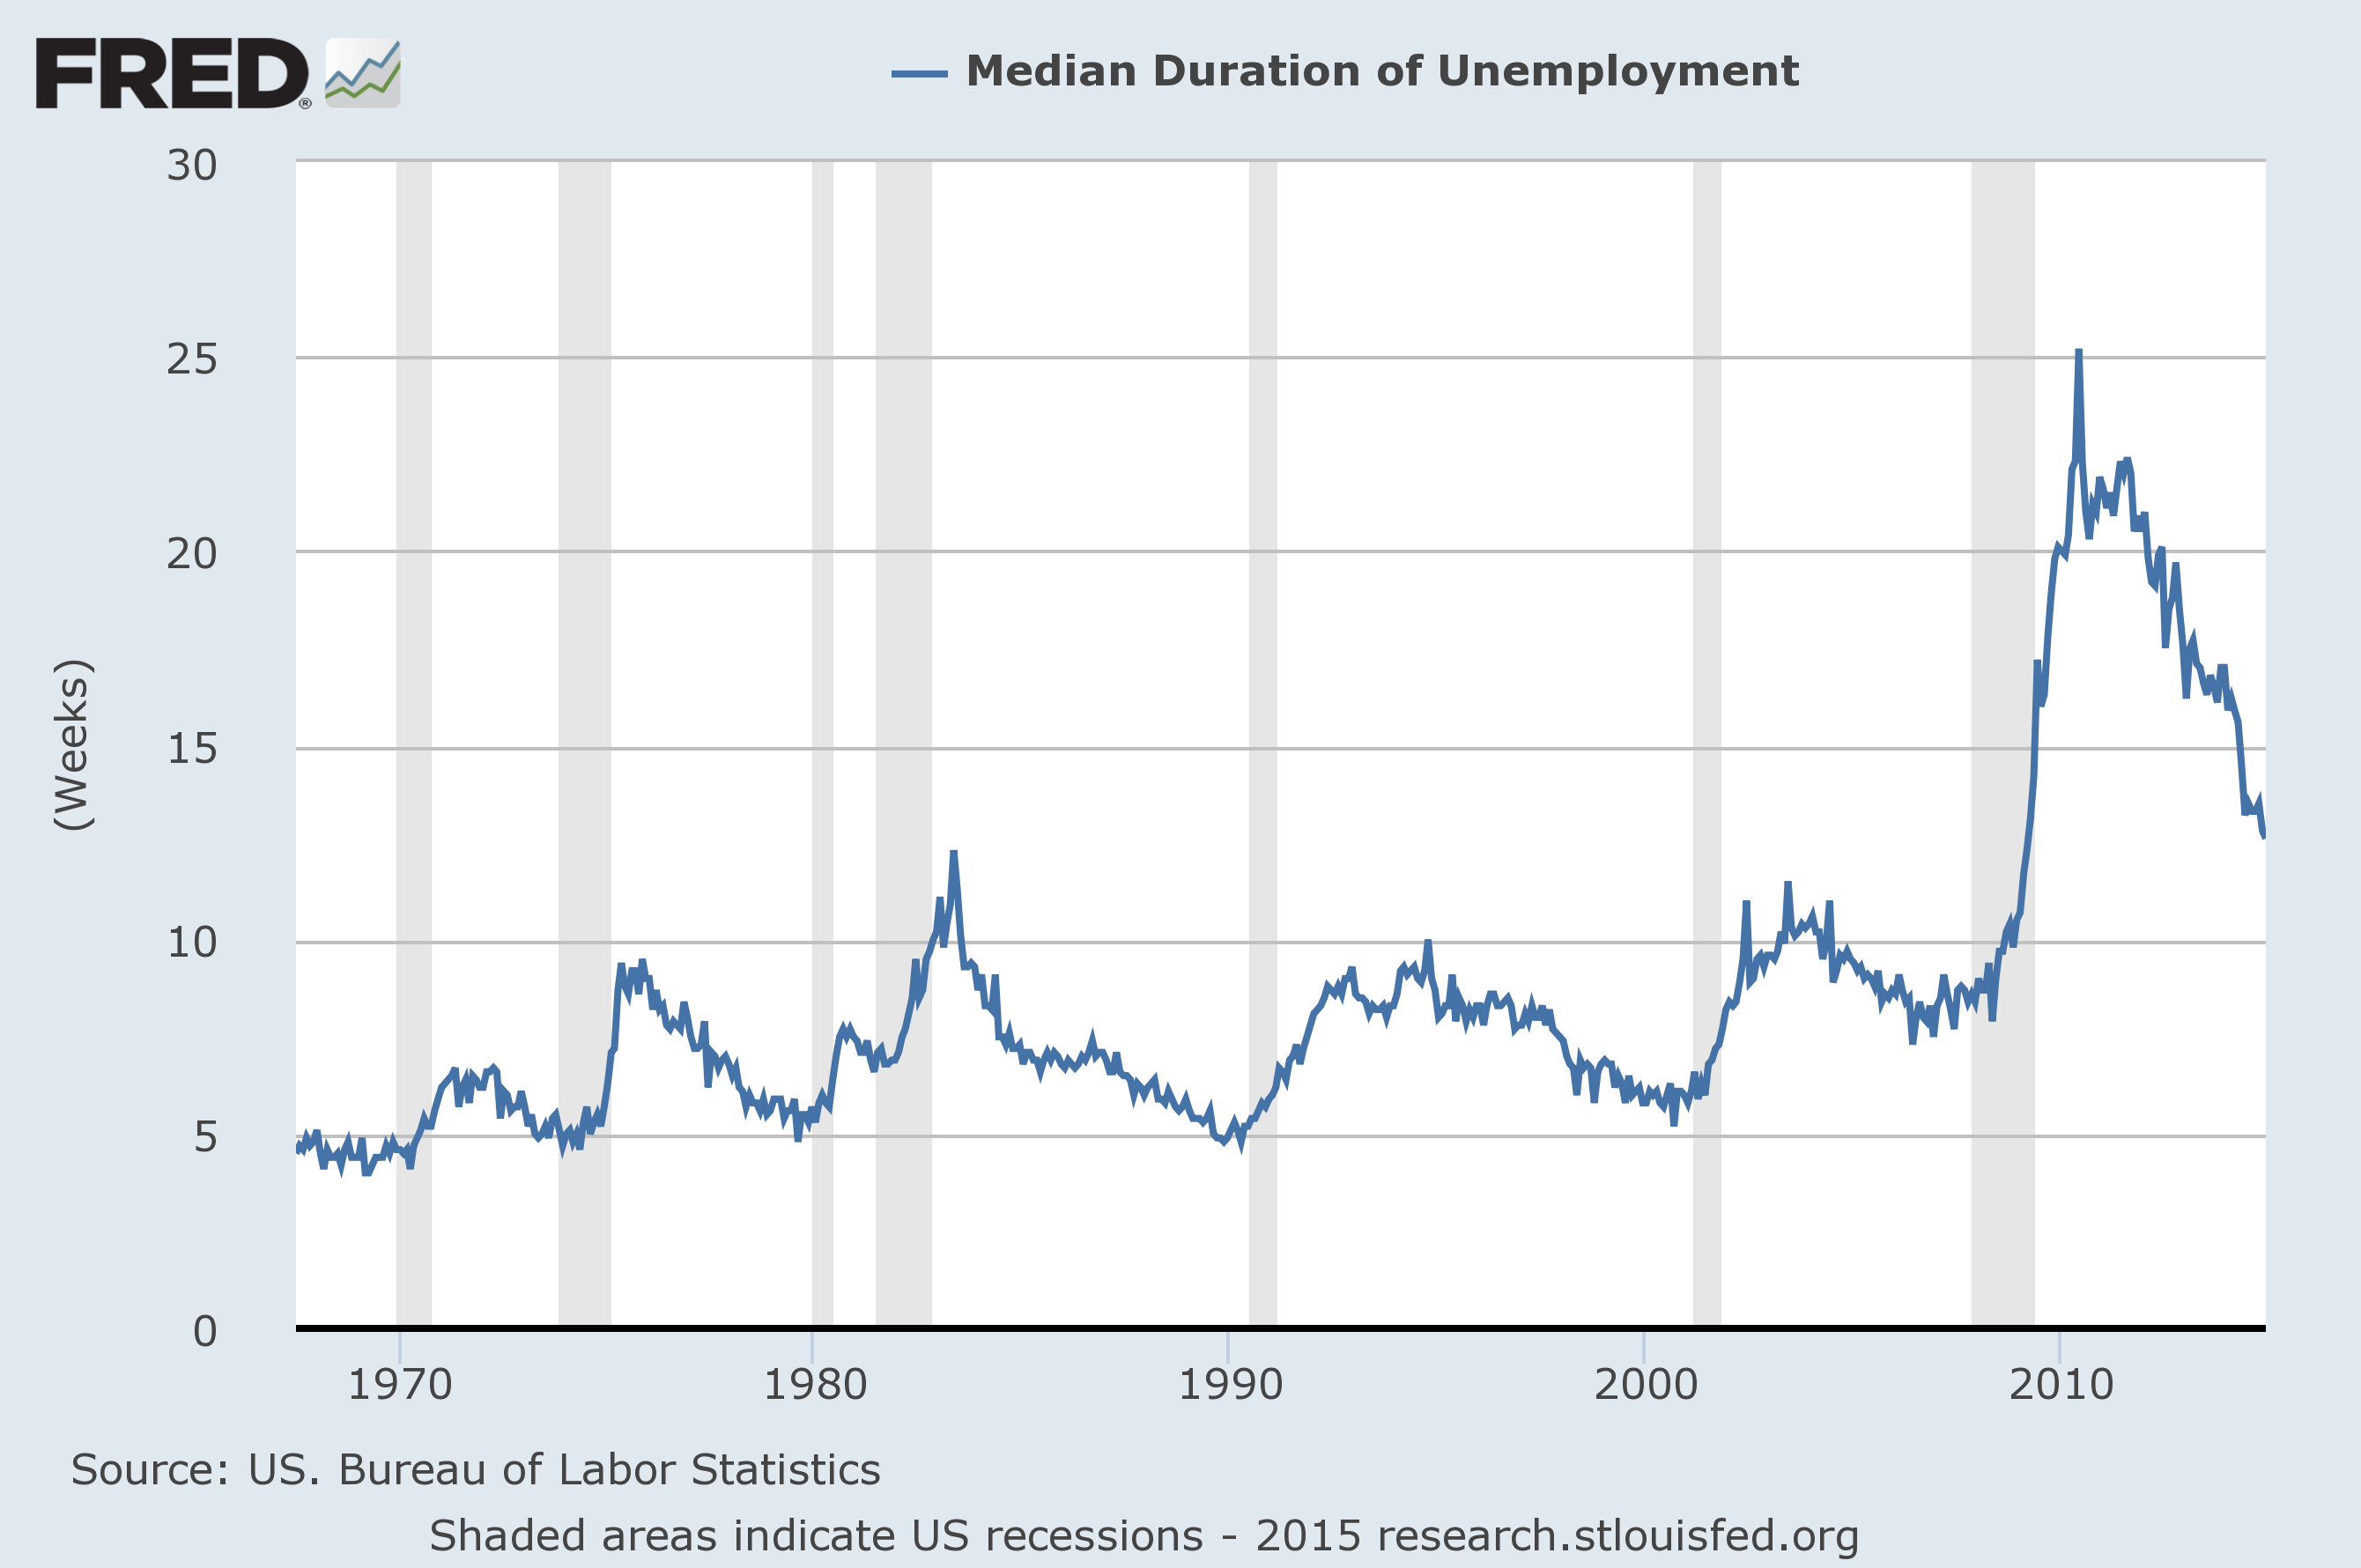
The three charts below are from the St. Louis Fed site.  Here is the Median Duration of Unemployment (current value = 12.6 weeks) :
(click on charts to enlarge images)(charts updated as of 1-9-15)
median duration of unemployment
Data Source: FRED, Federal Reserve Economic Data, Federal Reserve Bank of St. Louis: Median Duration of Unemployment [UEMPMED] ; U.S. Department of Labor: Bureau of Labor Statistics; accessed January 9, 2015;
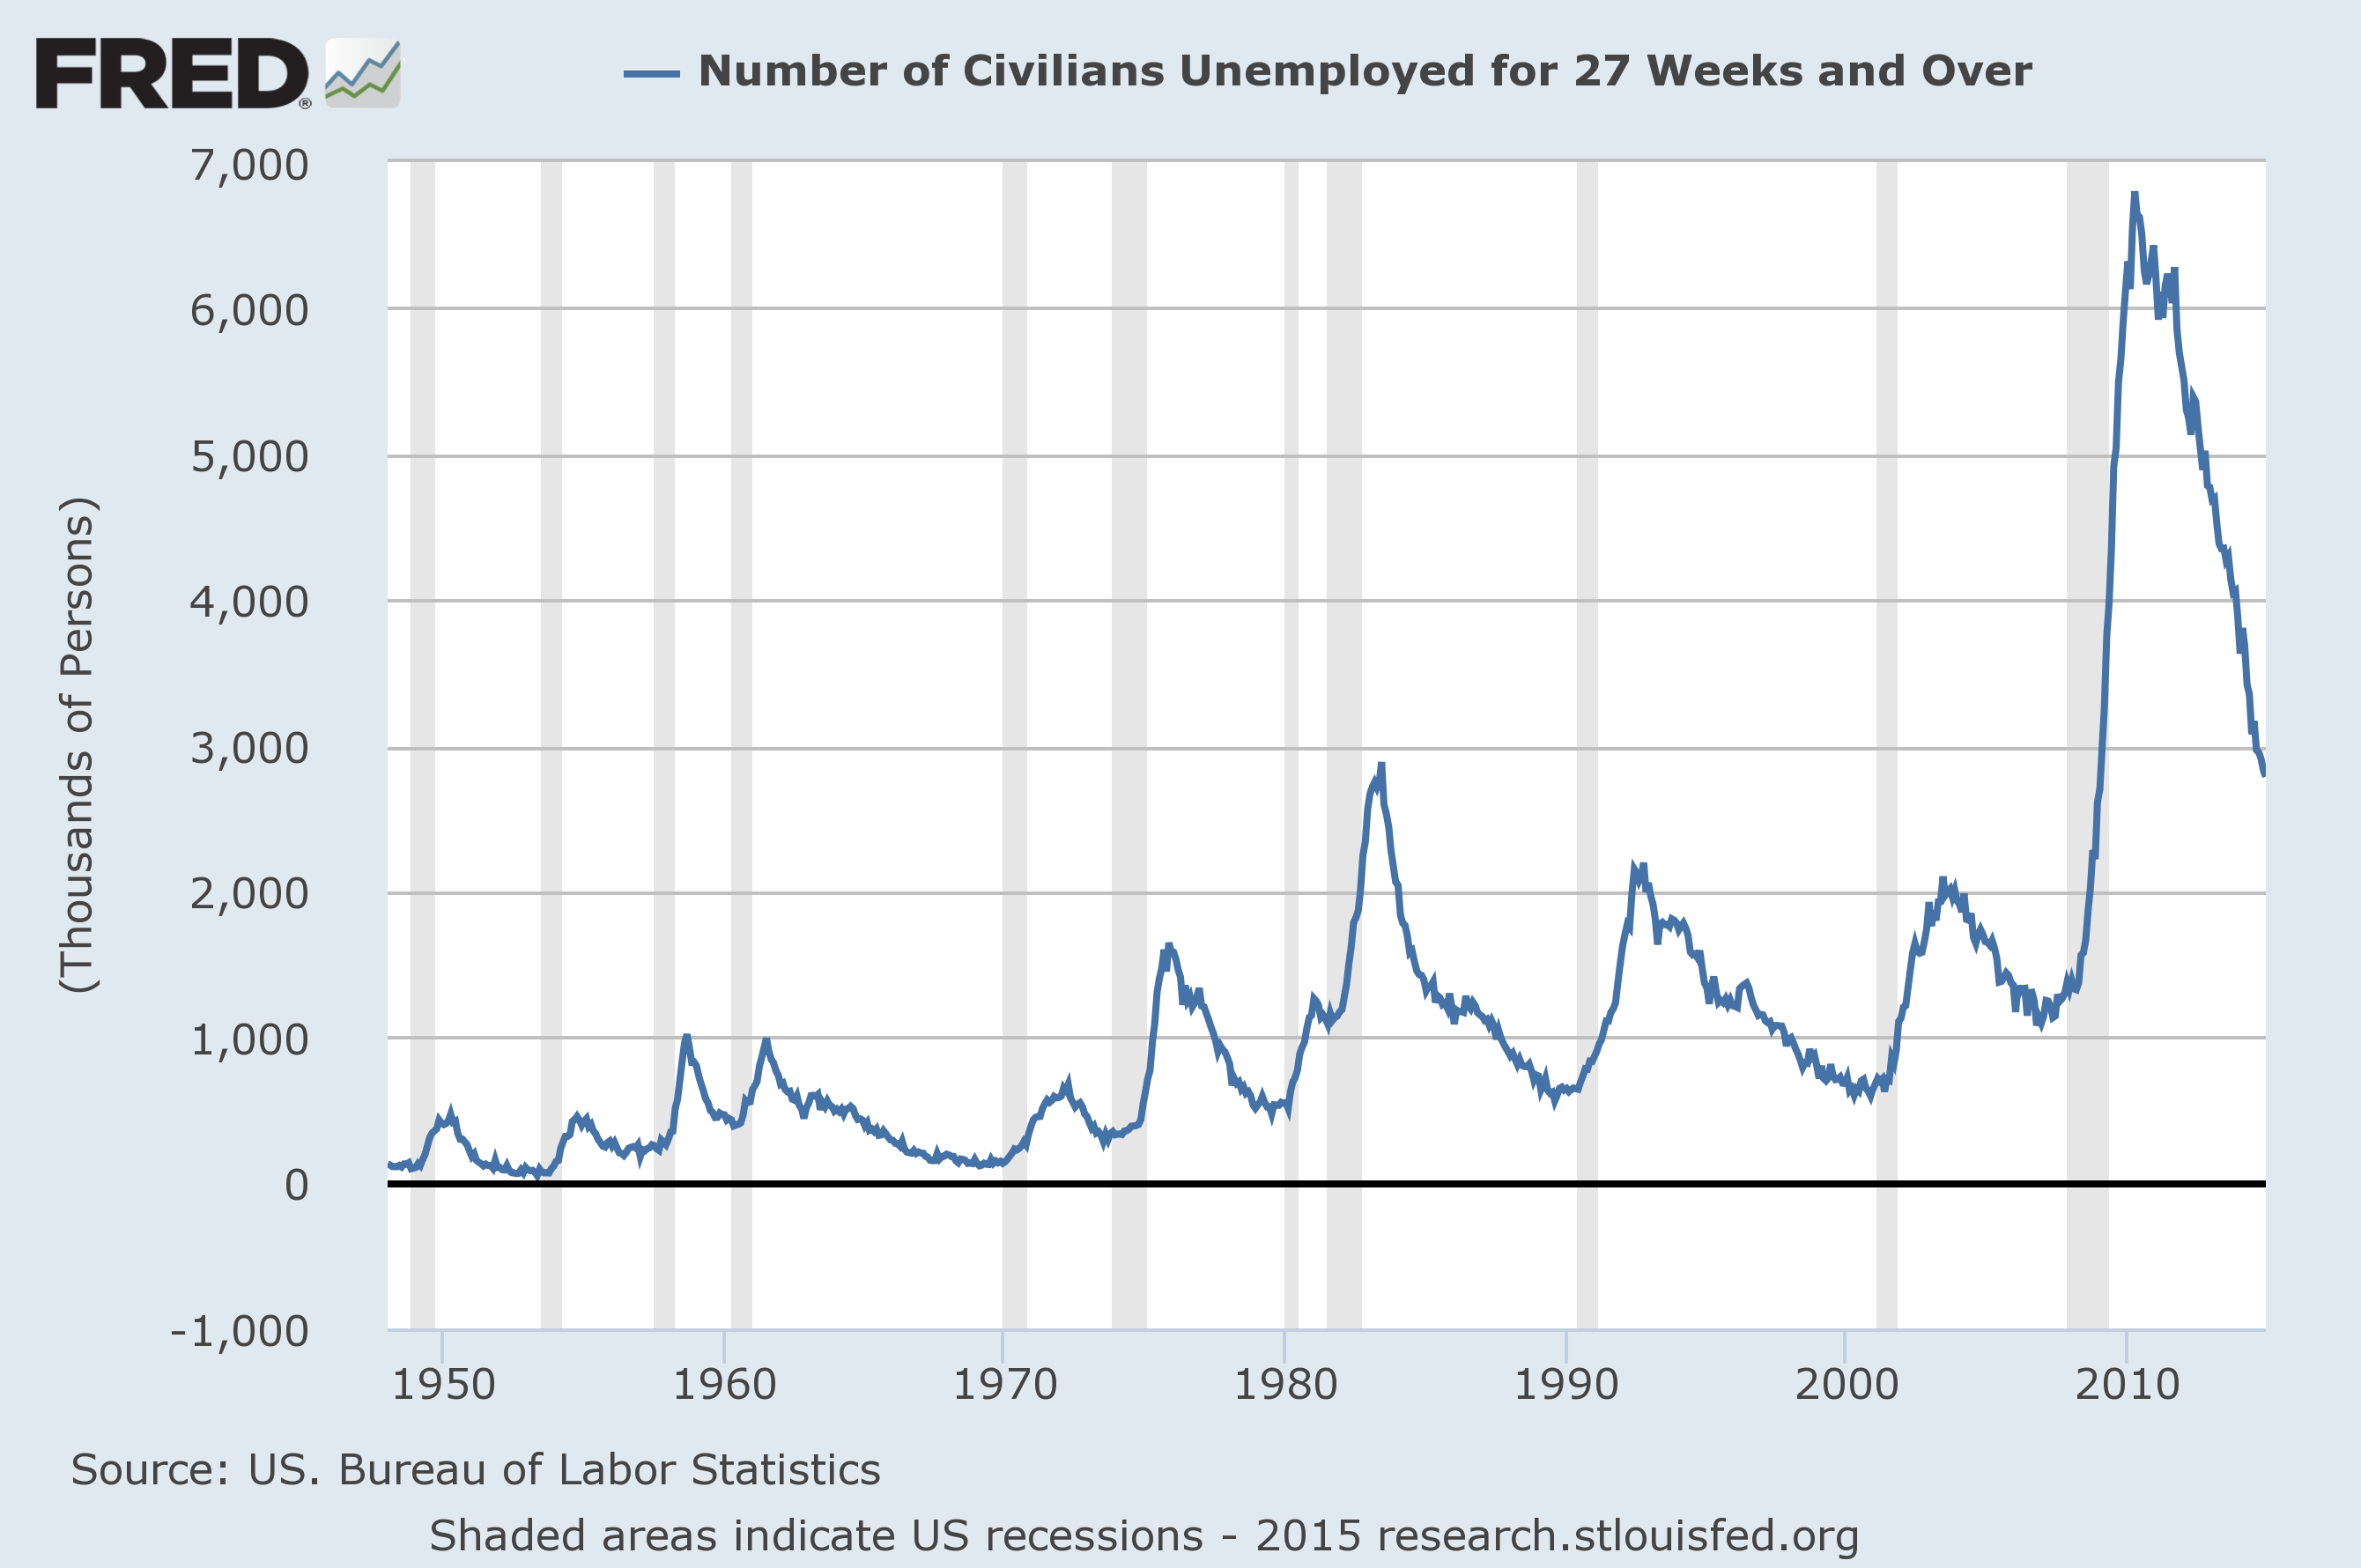
Here is the chart for Unemployed 27 Weeks and Over (current value = 2.785 million) :
unemployed 27 weeks and over
Data Source: FRED, Federal Reserve Economic Data, Federal Reserve Bank of St. Louis: Civilians Unemployed for 27 Weeks and Over [UEMP27OV] ; U.S. Department of Labor: Bureau of Labor Statistics; accessed January 9, 2015;
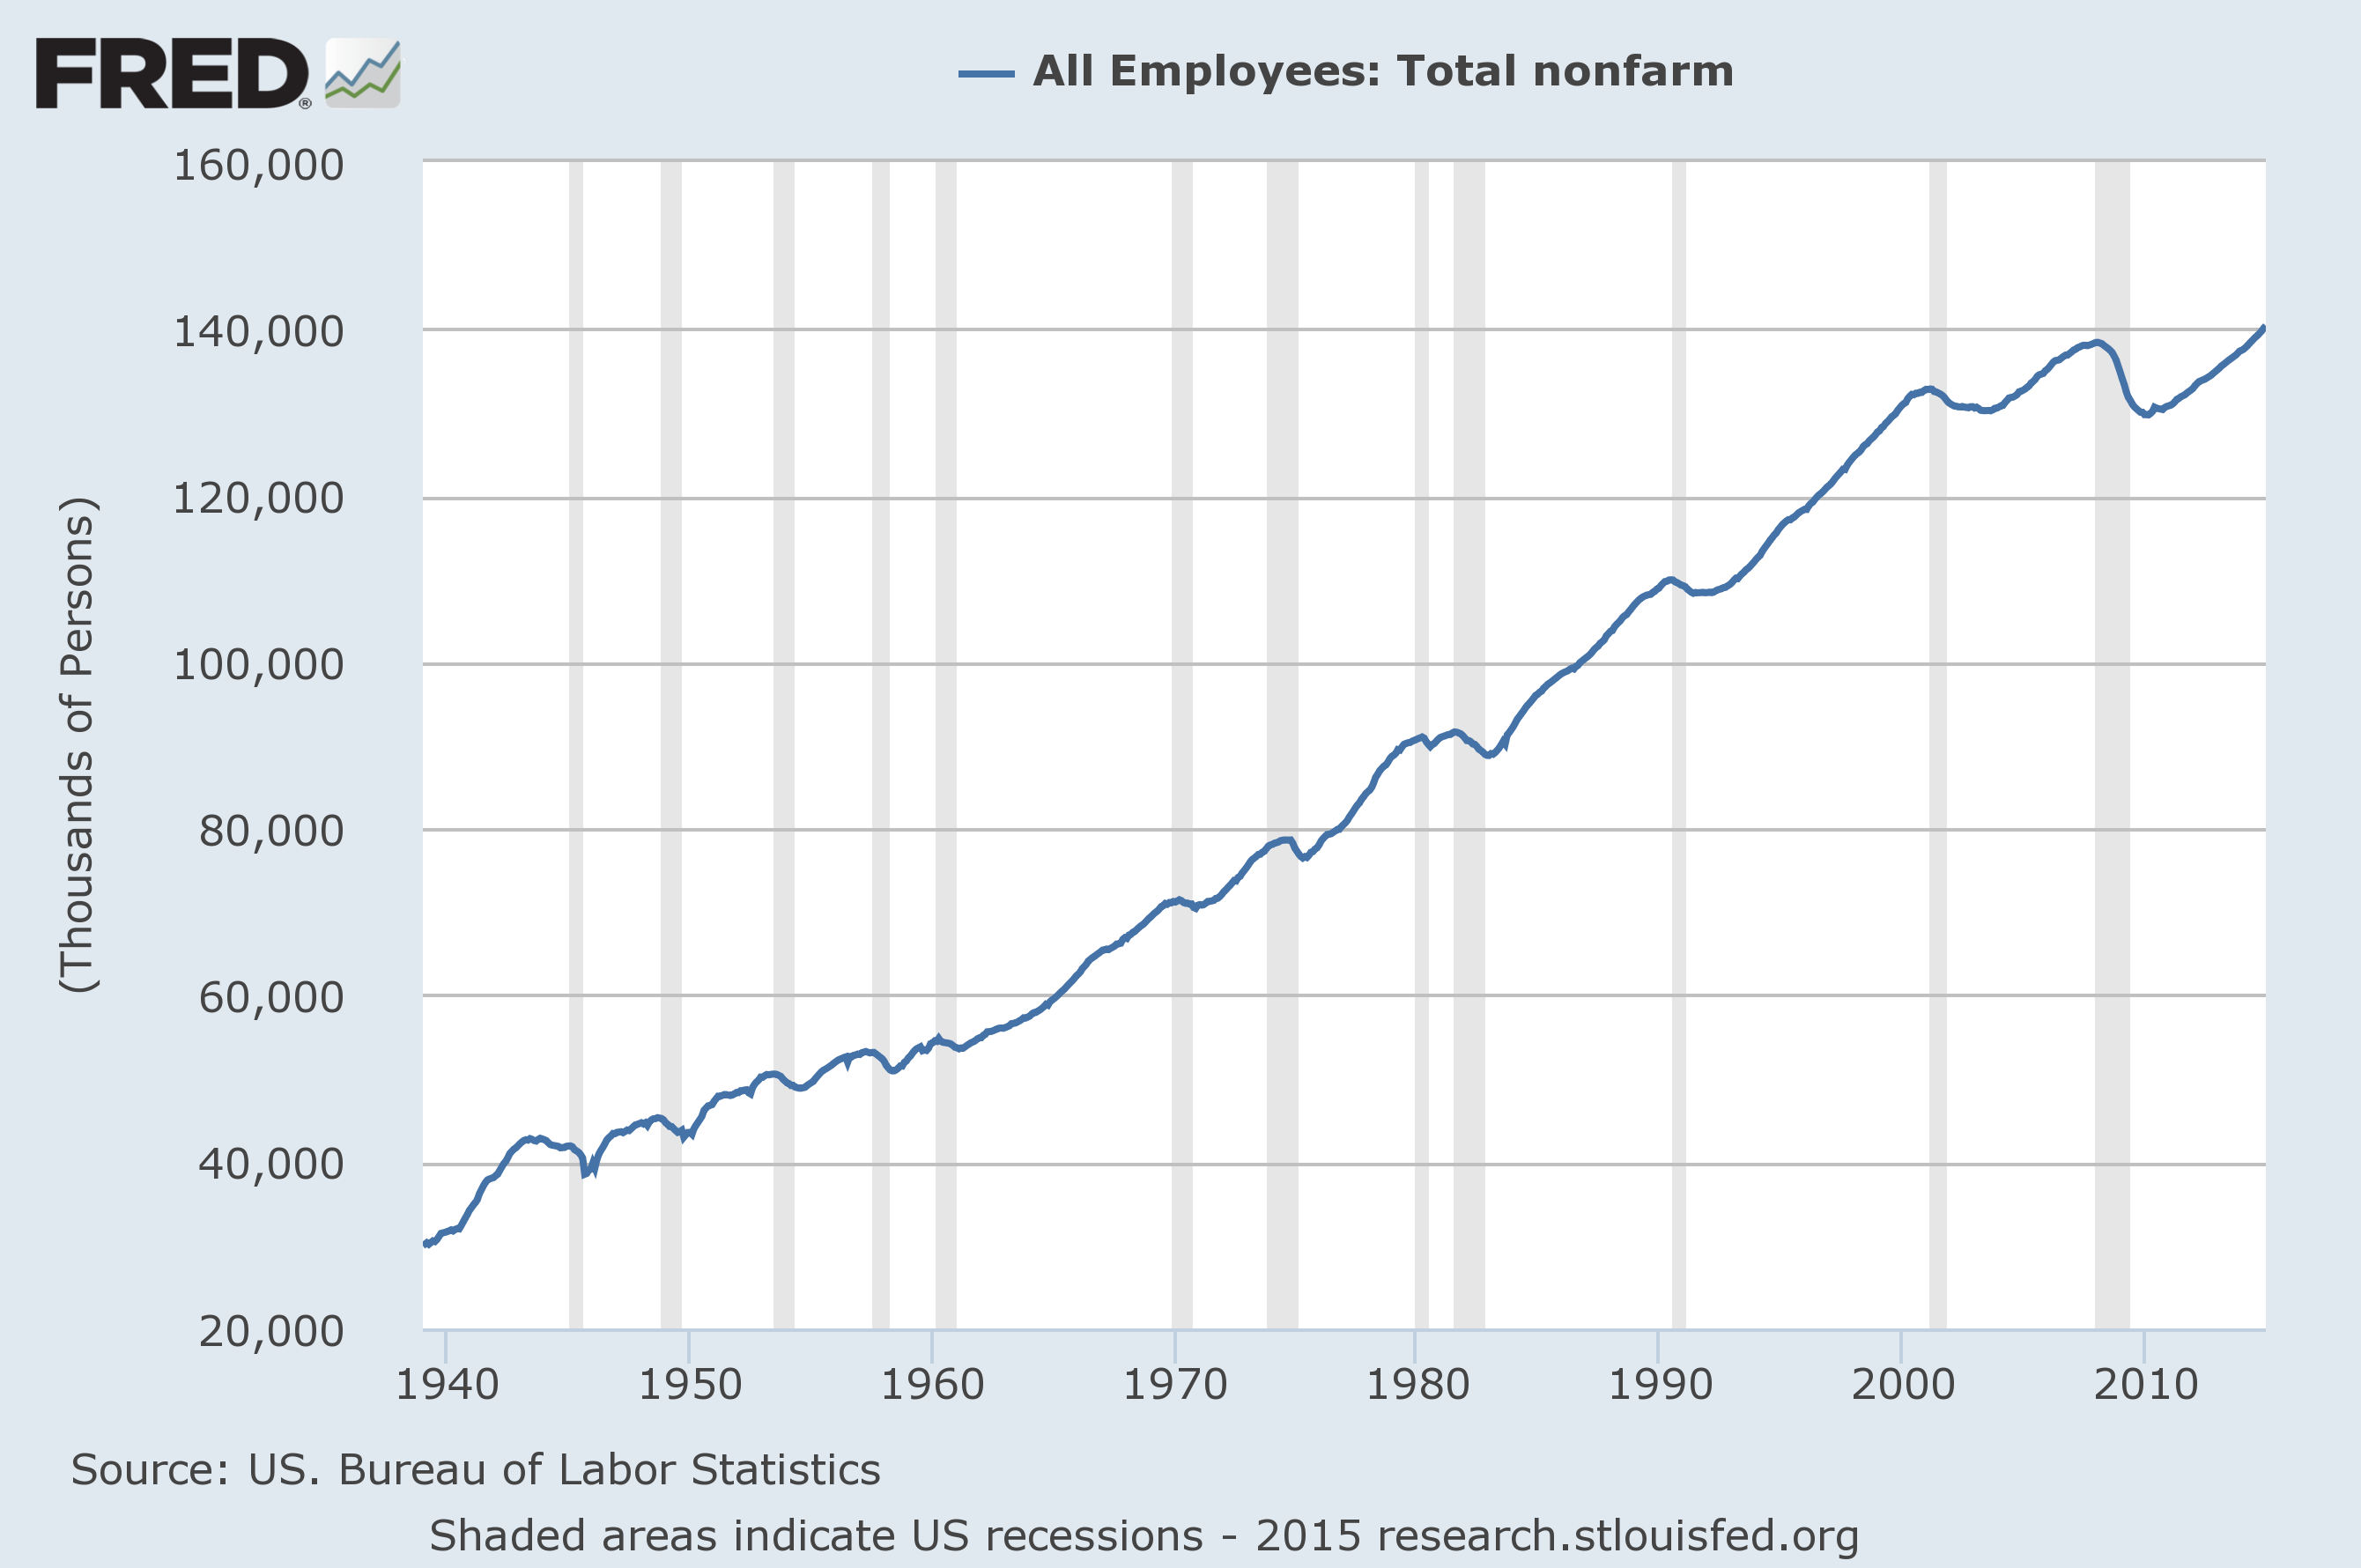
Here is the chart for Total Nonfarm Payroll (current value = 140.347 million) :
total nonfarm payrolls
Data Source: FRED, Federal Reserve Economic Data, Federal Reserve Bank of St. Louis: All Employees: Total nonfarm [PAYEMS] ; U.S. Department of Labor: Bureau of Labor Statistics; accessed January 9, 2015;
As depicted by these charts, our unemployment problem is severe.  Unfortunately, there do not appear to be any “easy” solutions.
On April 24, 2012 I wrote a five-part blog post titled “The Unemployment Situation Facing The United States”, which discusses various problematical issues concerning the present and future employment situation.
_____
The Special Note summarizes my overall thoughts about our economic situation
SPX at 2049.53 as this post is written

Financial Condition Of Many Americans

The financial condition of many Americans remains very disconcerting on many fronts, as seen in many statistics and empiricism.
I have have written many posts on this widespread problematical financial condition, and many of these posts are seen in the "paycheck to paycheck" label.
One recent notable report on the financial conditions of Americans includes the Russell Sage Foundation’s “Wealth Levels, Wealth Inequality, and The Great Recession“(pdf) which I mentioned in the August 7, 2014 post titled "Thoughts Concerning The Next Financial Crisis."  This report has information regarding individuals’ net worth, and portrays many deeply disconcerting aspects concerning net worth levels and trends.  Another report on the subject was the Federal Reserve's "Report on the Economic Well-Being of U.S. Households" (pdf) for 2013, and this was last discussed in the August 11, 2014 post titled "Financial Situation Experienced By Americans."
Since that time, there have been at least two more notable reports that provide insights into the financial condition of Americans.   One is the McKinsey report of December 2014 titled "America the frugal:  US Consumer Sentiment Survey."  Another is the bankrate.com survey discussed in the January 7, 2015 bankrate.com post titled "Budgets can crumble in times of trouble."
The McKinsey report contains various notable information, including indications of a continuing high level of consumers who report they are living "paycheck to paycheck."
The bankrate.com survey is dicussed in the Wall Street Journal post of January 7, 2015, titled "Most Americans Don't Have Savings to Pay Unexpected Bill."  An excerpt:
Only 38% of those polled said they could cover a $500 repair bill or a $1,000 emergency room visit with funds from their bank accounts, a new Bankrate report said. Most others would need to take on debt or cut back elsewhere.
Additional details can be seen in the reports and posts mentioned above.
_____
The Special Note summarizes my overall thoughts about our economic situation
SPX at 2062.14 as this post is written

Thursday, January 8, 2015

CEO Confidence Surveys 4Q 2014 – Notable Excerpts

On January 8, 2015, The Conference Board and PwC released the 4th Quarter Measure Of CEO Confidence.   The overall measure of CEO Confidence was at 60, up from 59 in the third quarter. [note:  a reading of more than 50 points reflects more positive than negative responses]
Notable excerpts from this January 8 Press Release include:
CEOs’ assessment of current economic conditions was virtually unchanged. Approximately 52 percent claim conditions are better compared to six months ago, about the same as in the third quarter of 2014. Business leaders’ appraisal of conditions in their own industries increased slightly, with 43 percent saying conditions in their own industries have improved, compared with 41 percent in the previous quarter.
CEOs’ expectations regarding the short-term outlook were more optimistic. About 49 percent of business leaders anticipate economic conditions will improve over the next six months, up from 44 percent in the previous quarter. However, 46 percent expect conditions to remain the same. Expectations for their own industries remain subdued, with 36 percent of CEOs anticipating an improvement, up from 34 percent in the third quarter. About 53 percent expect no change in conditions.
The Business Roundtable also released its CEO Economic Outlook Survey for the 4th Quarter of 2014 last month.   Notable excerpts from the December 2 release, titled “CEOs Forecast Weak Economic Growth in 2015”:
The Business Roundtable fourth quarter 2014 CEO Economic Outlook Index ‒ which provides a picture of the future direction of the U.S. economy based upon CEOs’ plans for sales, capital spending and hiring ‒ declined moderately from the third quarter, with capital spending declining the most.
also:
CEOs said they expect 2015 gross domestic product growth of 2.4 percent, unchanged from their 2014 expectation.
also:
The Business Roundtable CEO Economic Outlook Index – a composite index of CEO expectations for the next six months of sales, capital spending and employment – decreased moderately in the fourth quarter of 2014 to 85.1 from 86.4 in the third quarter of 2014. The long-term average of the Index is 80.3.
_____
I post various economic forecasts because I believe they should be carefully monitored.  However, as those familiar with this blog are aware, I do not necessarily agree with many of the consensus estimates and much of the commentary in these forecast surveys.
_____
The Special Note summarizes my overall thoughts about our economic situation
SPX at 2062.14 as this post is written

Deloitte “CFO Signals” Report Q4 2014 – Notable Aspects

Recently Deloitte released their “CFO Signals” “High-Level Summary” report for the 4th Quarter of 2014.
As seen in page 2 of the report, "One hundred and two CFOs responded during the two-week period ending November 21. Seventy-two percent of respondents are from public companies, and 82% are from companies with more than $1B in annual revenue. For more information, please see the “About the survey” section of this report."
Here are some of the excerpts that I found notable:
from page 3:
How do you regard the current and future status of the North American, Chinese, and European economies? Views of North America are again strongest, with a very high 63% of CFOs describing conditions as good (up from 44% last quarter), and the same proportion expecting better conditions in a year (up from 55% last quarter). Thirtyfour percent regard China’s economy as good (up from 27% last quarter), and 25% expect improvement (down from 29% last quarter). Just 2% describe Europe as good, and only 13% see it improving over the next year. Page 8.
What is your perception of the capital markets? Forty-nine percent of CFOs say external financial and economic risks are higher than normal, and 61% believe US markets are overvalued (both numbers are about the same as last quarter). An overwhelming 88% say debt is currently an attractive financing option, and 48% of public company CFOs view equity financing favorably (up sharply from 30%). Page 9.
Compared to the past 12 months, how do you expect your key operating metrics to change over the next 12 months? Revenue growth expectations, which reached their three-year high last quarter, receded from 6.8%* to 6.0%* but are still comparatively strong. Earnings expectations, coming off their highest level in more than a year, declined from 10.9%* to a still-strong 9.7%*. Capital spending rose from 5.0%* to 5.5%*—mostly because US CFOs’ estimates bounced back from last quarter’s surveylow 3.5%* to 5.8%* this quarter. Pages 11-13.
Compared to three months ago, how do you feel now about the financial prospects for your company? Continuing a string of seven straight quarters of positive net optimism, net optimism rose to a very strong +33.3. Forty-nine percent of CFOs express rising optimism (44% last quarter), and just 16% express declining optimism. Net optimism is lowest for Manufacturing, Energy/Resources, and Services. Page 14.
Overall, what external or internal risk worries you the most? CFOs’ most worrisome risks largely focus on the degree to which troubles in Europe, Asia, and Latin America will ultimately impact performance at home. And many relay worries that policymakers will struggle in trying to spur growth. Page 15. 
*These averages are means that have been adjusted to eliminate the effects of stark outliers.
from page 11:

Revenue and earnings

What are CFOs’ expectations for their companies’ year-over-year revenue and earnings?
Revenue*
Revenue growth expectations declined, but are still among the highest in the last three years:
  • Revenue growth expectations fell to 6.0% from 6.8% last quarter. The median is again 5.0%, with 90% of CFOs expecting year-over-year gains. Variability of responses is near the survey low for this metric.
  • Country-specific expectations are 5.9% for the US (down from 6.2%), 5.0% for Canada (down from 9.3%), and 9.8% for Mexico (up from 8.8%).
  • Healthcare/Pharma and T/M/E have the highest expectations at 12.1% and 8.4%, respectively, while Energy/Resources and Retail/Wholesale CFOs have lowest expectations at 4.0 and 4.6%, respectively.
Earnings*
Earnings growth expectations declined, but are still relatively strong— bolstered mostly by the Healthcare/Pharma and T/M/E sectors:
  • Earnings expectations fell to 9.7% from 10.9% last quarter. The median remained at 8.0%, and 86% of CFOs expect year-over-year gains. Variability of responses is again comparatively low.
  • Country-specific expectations are 10.8% for the US (11.6% last quarter), 4.5% for Canada (10.2% last quarter), and 10.5% for Mexico (7.2% last quarter).
*All averages have been adjusted to eliminate the effects of stark outliers.

from page 13:

Employment

What are CFOs’ expectations for their companies’ year-over-year hiring?
Domestic hiring*
Hiring expectations declined, but are again near their four-year high:
  • Domestic hiring expectations fell to 2.1%, down from last quarter’s 2.3%. The median remained at 1.0%, and 60% of CFOs expect year-over-year gains, consistent with last quarter's level.
  • Country-specific expectations are 1.7% for the US (same as last quarter), 2.2% for Canada (3.5% last quarter), and 6.1% for Mexico (6.5% last quarter).
Offshore hiring*
Offshore hiring expectations declined, but are still relatively high:  •  Offshore hiring decreased to 2.0% from last quarter’s 2.6%. The median remained at 0.0%.
  • Country-specific expectations are 2.1% for the US, 1.3% for Canada, and
2.0% for Mexico.
  • T/M/E CFOs have the highest expectations at 3.8%. Retail/Wholesale, and Services reported less than 1.0%. Forty-four percent of CFOs expect year-over-year gains.
*All averages have been adjusted to eliminate the effects of stark outliers.

Among the various charts and graphics in the report are graphics depicting trends in “Own Company Optimism” and “Economic Optimism” found on page 7.
_____
I post various business and economic surveys because I believe they should be carefully monitored.  However, as those familiar with this blog are aware, I do not necessarily agree with many of the consensus estimates and much of the commentary in these surveys.
_____
The Special Note summarizes my overall thoughts about our economic situation
SPX at 2058.97 as this post is written
Building Financial Danger – January 8, 2015 Update

On October 17, 2011 I wrote a post titled “Danger Signs In The Stock Market, Financial System And Economy.”  This post is a brief 44nd update to that post.
My overall analysis indicates a continuing elevated and growing level of financial danger which contains many worldwide and U.S.-specific “stresses” of a very complex nature. I have written numerous posts in this blog of some of what I consider both ongoing and recent “negative developments.”  These developments, as well as other exceedingly problematic conditions, have presented a highly perilous economic environment that endangers the overall financial system.
Also of ongoing immense importance is the existence of various immensely large asset bubbles, a subject of which I have extensively written.  While all of these asset bubbles are wildly pernicious and will have profound adverse future implications, hazards presented by the bond market bubble are especially notable.
Predicting the specific timing and extent of a stock market crash is always difficult, and the immense complexity of today’s economic situation makes such a prediction even more challenging. With that being said, my analyses indicate that the danger inherent in the financial system has surpassed the level at which a near-term outsized (from an ultra-long term perspective) stock market crash – that would also involve (as seen in 2008) various other markets as well – is of tremendous concern.
(note: the “next crash” has great significance and implications, as discussed in the post of January 6, 2012 titled “The Next Crash And Its Significance“ and subsequent posts in the “Economic Depression” category)
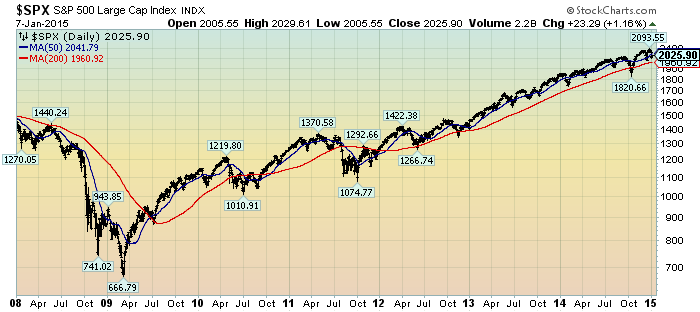
As reference, below is a daily chart since 2008 of the S&P500 (with a last price of 2025.90), depicted on a LOG scale, indicating both the 50dma and 200dma as well as price labels:
(click on chart to enlarge image)(chart courtesy of StockCharts.com; chart creation and annotation by the author)
S&P500 since 2008
_____
The Special Note summarizes my overall thoughts about our economic situation
SPX at 2025.90 as this post is written

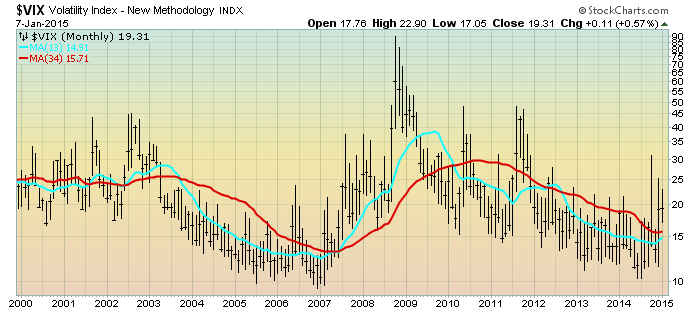
VIX Weekly And Monthly Charts Since The Year 2000 – January 8, 2015 Update

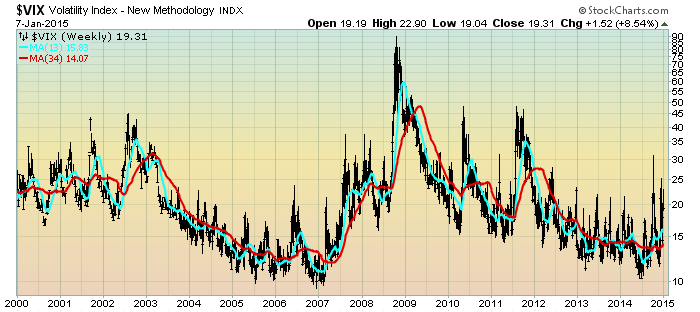
For reference purposes, below are two charts of the VIX from year 2000 through yesterday’s (January 7, 2015) close, which had a closing value of 19.31:
Below is the VIX Weekly chart, depicted on a LOG scale, with the 13- and 34-week moving averages, seen in the cyan and red lines, respectively:
(click on chart to enlarge image)(chart courtesy of StockCharts.com; chart creation and annotation by the author)
VIX Weekly Chart
Here is the VIX Monthly chart, depicted on a LOG scale, with the 13- and 34-month moving average, seen in the cyan and red lines, respectively:
(click on chart to enlarge image)(chart courtesy of StockCharts.com; chart creation and annotation by the author)
VIX Monthly chart
_____
The Special Note summarizes my overall thoughts about our economic situation
SPX at 2025.90 as this post is written