In the November 13, 2013 post (“Not In Labor Force Statistic“) I featured editorial commentary from the Wall Street Journal, as well as an accompanying long-term chart, with regard to the number of people not working.
Below is an updated chart regarding this statistic. The current figure, last updated on December 8, 2023 depicting data through November 2023, is 99.845 million people (Not Seasonally Adjusted):
Data Source: U.S. Bureau of Labor Statistics, Not in Labor Force [LNU05000000], retrieved from FRED, Federal Reserve Bank of St. Louis; accessed December 11, 2023: https://fred.stlouisfed.org/series/LNU05000000
_____
The Special Note summarizes my overall thoughts about our economic situation
Along these lines, one of the measures showing disconcerting trends is that of hourly earnings.
While the concept of hourly earnings can be defined and measured in a variety of ways, below are a few charts that I believe broadly illustrate problematic trends.
The first chart depicts Average Hourly Earnings Of All Employees: Total Private (FRED series CES0500000003)(current value = $34.10):
(click on chart to enlarge image)(chart last updated 12-8-23)
Data Source: FRED, Federal Reserve Economic Data, Federal Reserve Bank of St. Louis: Average Hourly Earnings of All Employees: Total Private [CES0500000003] ; U.S. Department of Labor: Bureau of Labor Statistics; accessed December 8, 2023: http://research.stlouisfed.org/fred2/series/CES0500000003
–
This next chart depicts this same measure on a “Percentage Change From A Year Ago” basis. While not totally surprising, I find the decline from 2009 and subsequent trend to be disconcerting:
(click on chart to enlarge image)(chart last updated 12-8-23)
–
There are slightly different measures available from a longer-term perspective. Pictured below is another measure, the Average Hourly Earnings of Production and Nonsupervisory Employees – Total Private (FRED series AHETPI)(current value = $29.30):
(click on chart to enlarge image)(chart last updated 12-8-23)
Data Source: FRED, Federal Reserve Economic Data, Federal Reserve Bank of St. Louis: Average Hourly Earnings of Production and Nonsupervisory Employees: Total Private [AHETPI] ; U.S. Department of Labor: Bureau of Labor Statistics; accessed December 8, 2023: http://research.stlouisfed.org/fred2/series/AHETPI
–
Pictured below is this AHETPI measure on a “Percentage Change From A Year Ago” basis. While not totally surprising, I find the decline from 2009 and subsequent trend to be disconcerting:
(click on chart to enlarge image)(chart last updated 12-8-23)
I will continue to actively monitor these trends, especially given the post-2009 dynamics.
_________
I post various economic indicators and indices because I believe they should be carefully monitored. However, as those familiar with this site are aware, I do not necessarily agree with what they depict or imply.
_____
The Special Note summarizes my overall thoughts about our economic situation
Shortly after each monthly employment report I have been posting a continual series titled “3 Critical Unemployment Charts.”
Of course, there are many other employment charts that can be displayed as well.
For reference purposes, below are the U-3 and U-6 Unemployment Rate charts from a long-term historical perspective. Both charts are from the St. Louis Fed site. The U-3 measure is what is commonly referred to as the official unemployment rate; whereas the U-6 rate is officially (per Bureau of Labor Statistics) defined as:
Total unemployed, plus all persons marginally attached to the labor force, plus total employed part time for economic reasons, as a percent of the civilian labor force plus all persons marginally attached to the labor force
Of note, many economic observers use the U-6 rate as a (closer) proxy of the actual unemployment rate rather than that depicted by the U-3 measure.
Here is the U-3 chart, currently showing a 3.7% unemployment rate:
Data Source: FRED, Federal Reserve Economic Data, Federal Reserve Bank of St. Louis: Civilian Unemployment Rate [UNRATE] ; U.S. Department of Labor: Bureau of Labor Statistics; accessed December 8, 2023: http://research.stlouisfed.org/fred2/series/UNRATE
–
Here is the U-6 chart, currently showing a 7.0% unemployment rate:
Data Source: FRED, Federal Reserve Economic Data, Federal Reserve Bank of St. Louis: Total unemployed, plus all marginally attached workers plus total employed part time for economic reasons [U6RATE] ; U.S. Department of Labor: Bureau of Labor Statistics; accessed December 8, 2023: http://research.stlouisfed.org/fred2/series/U6RATE
_____
The Special Note summarizes my overall thoughts about our economic situation
As I have commented previously, as in the October 6, 2009 post (“A Note About Unemployment Statistics”), in my opinion the official methodologies used to measure the various job loss and unemployment statistics do not provide an accurate depiction; they serve to understate the severity of unemployment.
However, even if one chooses to look at the official statistics, the following charts provide an interesting (and disconcerting) long-term perspective of certain aspects of the officially-stated unemployment (and, in the third chart, employment) situation.
The three charts below are from the St. Louis Fed site. Here is the Median Duration of Unemployment (current value = 9.2 weeks):
(click on charts to enlarge images)(charts updated as of 12-8-23)
Data Source: FRED, Federal Reserve Economic Data, Federal Reserve Bank of St. Louis: Median Duration of Unemployment [UEMPMED] ; U.S. Department of Labor: Bureau of Labor Statistics; accessed December 8, 2023: http://research.stlouisfed.org/fred2/series/UEMPMED
–
Here is the chart for Unemployed 27 Weeks and Over (current value = 1.150 million):
Data Source: FRED, Federal Reserve Economic Data, Federal Reserve Bank of St. Louis: Civilians Unemployed for 27 Weeks and Over [UEMP27OV] ; U.S. Department of Labor: Bureau of Labor Statistics; accessed December 8, 2023: http://research.stlouisfed.org/fred2/series/UEMP27OV
–
Here is the chart for Total Nonfarm Payroll (current value = 157.087 million):
Data Source: FRED, Federal Reserve Economic Data, Federal Reserve Bank of St. Louis: All Employees: Total Nonfarm [PAYEMS] ; U.S. Department of Labor: Bureau of Labor Statistics; accessed December 8, 2023: https://research.stlouisfed.org/fred2/series/PAYEMS
–
Our unemployment problem is severe. The underlying dynamics of the current – and especially future – unemployment situation remain exceedingly worrisome. These dynamics are numerous and complex, and greatly lack recognition and understanding.
My commentary regarding unemployment is generally found in the “Unemployment” category. This commentary includes the page titled “U.S. Unemployment Trends,” which discusses various problematical issues concerning the present and future employment situation.
_____
The Special Note summarizes my overall thoughts about our economic situation
My overall analysis indicates a continuing elevated and growing level of financial danger which contains many worldwide and U.S.-specific “stresses” of a very complex nature. I have written numerous posts on this site concerning both ongoing and recent “negative developments.” These developments, as well as other exceedingly problematical conditions, have presented a highly perilous economic environment that endangers the overall financial system.
Also of ongoing immense importance is the existence of various immensely large asset bubbles, a subject of which I have extensively written. While all of these asset bubbles are wildly pernicious and will have profound adverse future implications, hazards presented by the bond market bubble are especially notable.
Predicting the specific timing and extent of a stock market crash is always difficult, and the immense complexity of today’s economic situation makes such a prediction even more challenging. With that being said, my analyses continue to indicate that a near-term exceedingly large (from an ultra long-term perspective) stock market crash – that would also involve (as seen in 2008) various other markets – will occur. [note: the “next crash” and its aftermath has paramount significance and implications, as discussed in the post of January 6, 2012 titled “The Next Crash And Its Significance“ and various subsequent posts in the “Economic Depression” label]
As reference, below is a daily chart since 2008 of the S&P500 (through December 7, 2023 with a last price of 4585.59), depicted on a LOG scale, indicating both the 50dma and 200dma as well as price labels:
(click on chart to enlarge image)(chart courtesy of StockCharts.com; chart creation and annotation by the author)
_____
The Special Note summarizes my overall thoughts about our economic situation
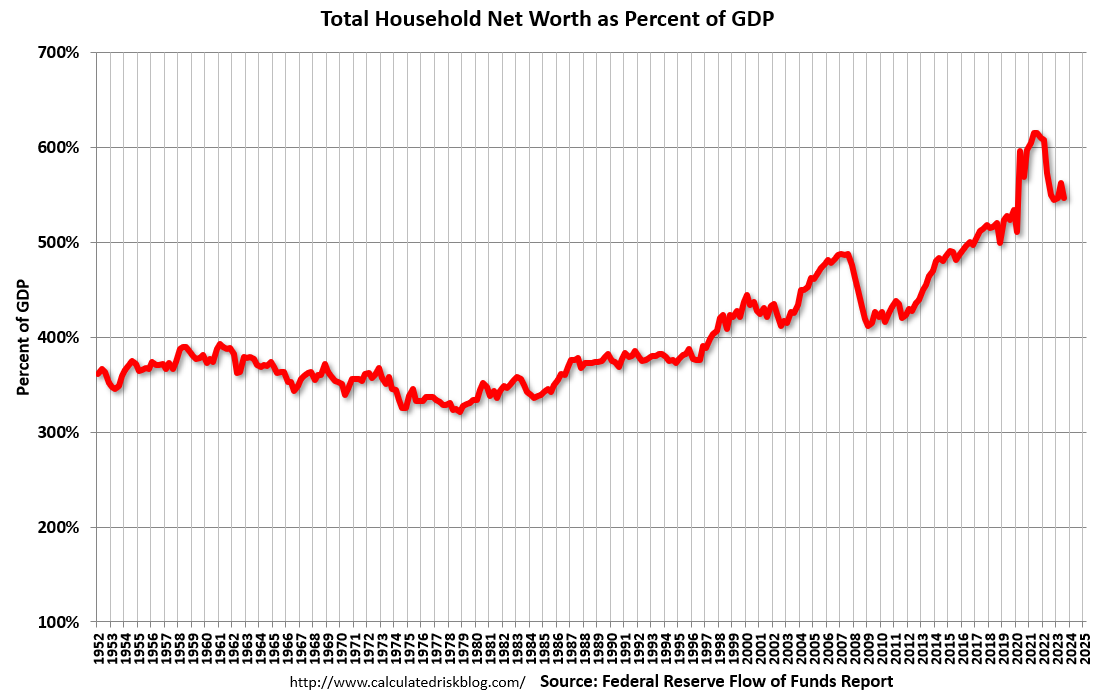
For reference purposes, here is Total Household Net Worth from a long-term perspective (from 1945:Q4 through 2023:Q3). The last value (as of the December 7, 2023 update) is $150.988726 Trillion:
(click on each chart to enlarge image)
–
Also of interest is the same metric presented on a “Percent Change from a Year Ago” basis, with a current value of 5.7%:
As seen in the above-referenced CalculatedRisk post:
The net worth of households and nonprofits fell to $151.0 trillion during the third quarter of 2023. The value of directly and indirectly held corporate equities decreased $1.7 trillion and the value of real estate increased $0.5 trillion.
As one can see in the above chart, the first outsized peak was in 2000, and attained after the stock market bull market / stock market bubbles and economic strength. The second outsized peak was in 2007, right near the peak of the housing bubble as well as near the stock market peak. A third outsized peak appears to have formed between 2021 and 2022.
_____
The Special Note summarizes my overall thoughts about our economic situation
Throughout this site there are many discussions of economic indicators. This post is the latest in a series of posts indicating facets of U.S. economic weakness or a notably low growth rate.
The level and trend of economic growth is especially notable at this time. As seen in various sources, recession estimates have been at high levels.
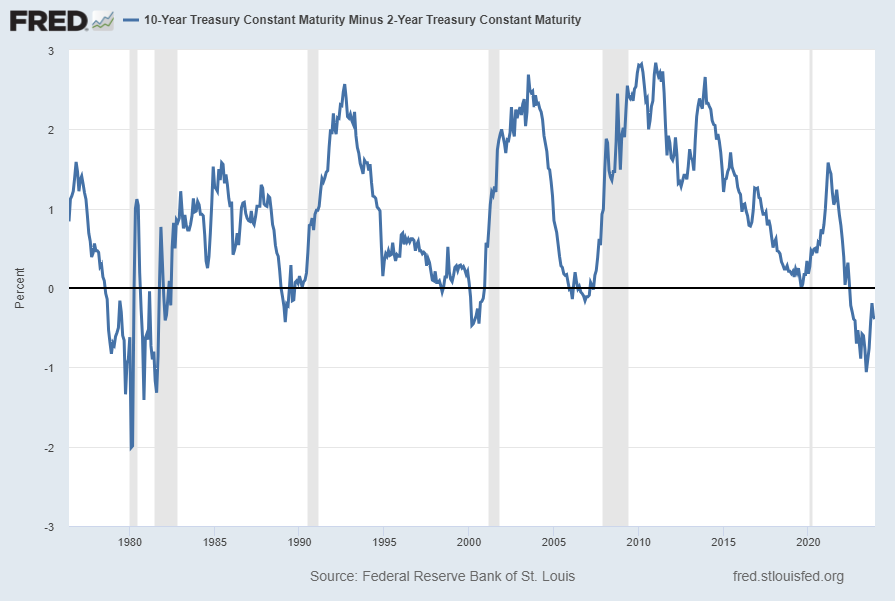
While I continue to have the stated reservations regarding the “Yield Curve” as an indicator, I do believe that it should be monitored.
The U.S. Yield Curve (one proxy seen below) is (all things considered) notably inverted when viewed from a long-term perspective. Below is the spread between the 10-Year Treasury Constant Maturity and the 2-Year Treasury Constant Maturity from June 1976 through the December 5, 2023 update, showing a value of -.39% [10-Year Treasury Yield (FRED DGS10) of 4.28% as of the December 5 update, 2-Year Treasury Yield (FRED DGS2) of 4.64% as of the December 5 update]:
source: Federal Reserve Bank of St. Louis, 10-Year Treasury Constant Maturity Minus 2-Year Treasury Constant Maturity [T10Y2Y], retrieved from FRED, Federal Reserve Bank of St. Louis; accessed December 6, 2023: https://fred.stlouisfed.org/series/T10Y2Y
__
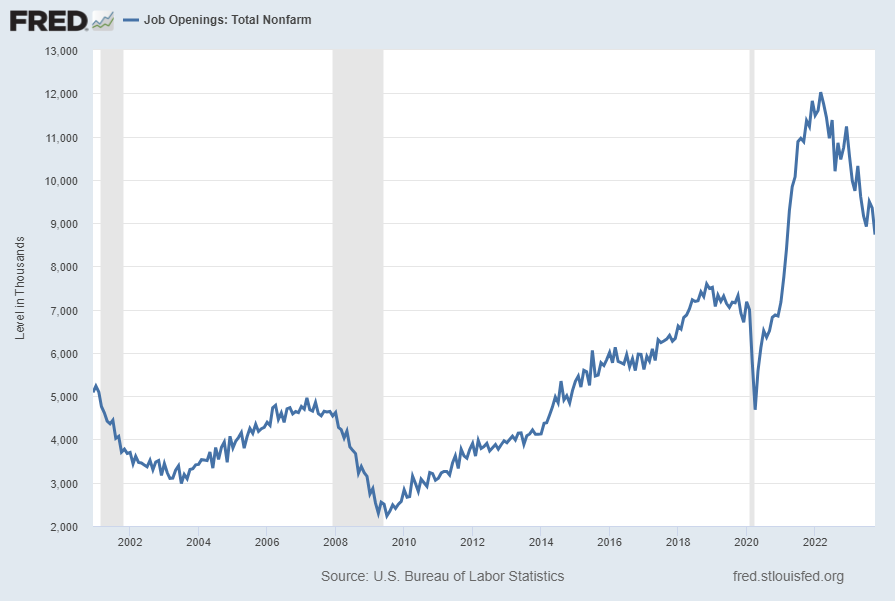
Job Openings (JTSJOL)
Job openings (Job Openings: Total Nonfarm [JTSJOL]), although still at a (very) high level, have recently declined significantly. This “Job Openings” measure had a value of 8,733 (Thousands) through October 2023 as of the December 5, 2023 update, as shown below:
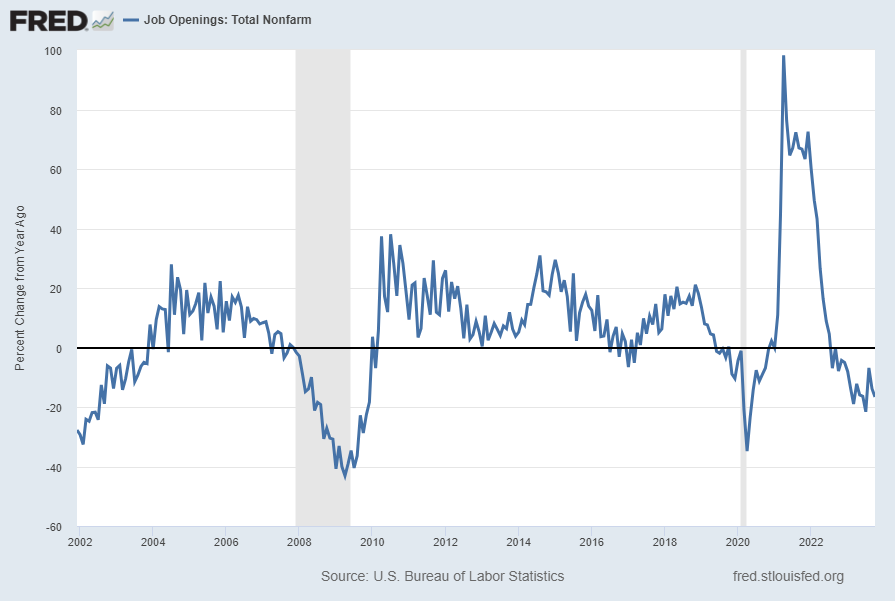
Below is this measure displayed on a “Percent Change From Year Ago” basis with value -16.6%:
source: U.S. Bureau of Labor Statistics, Job Openings: Total Nonfarm [JTSJOL], retrieved from FRED, Federal Reserve Bank of St. Louis; accessed December 6, 2023: https://fred.stlouisfed.org/series/JTSJOL
__
Truck Tonnage (TRUCKD11)
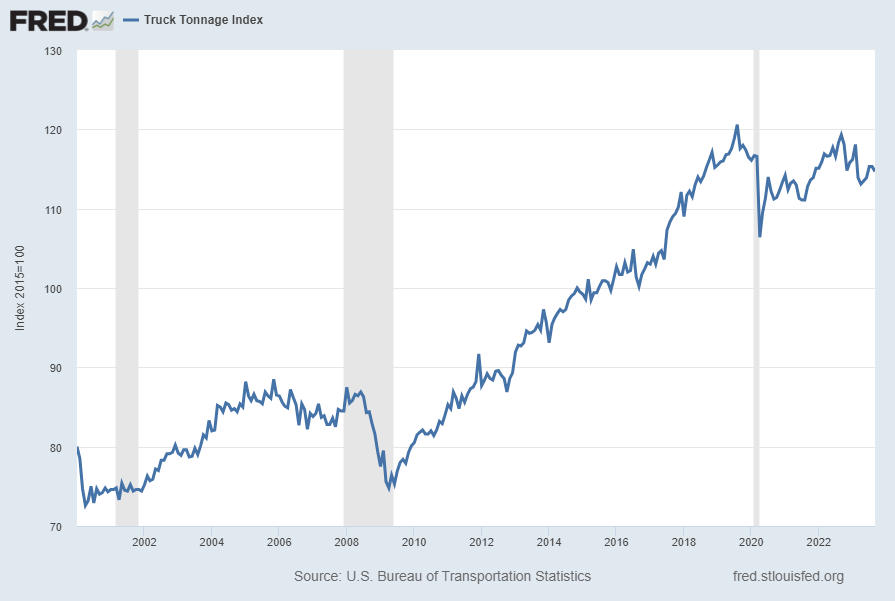
“Truck Tonnage” (TRUCKD11) has yet to reach its pre-pandemic peak, and has recently been faltering. Shown below is this measure with last value of 114.7 through September, last updated December 6, 2023:
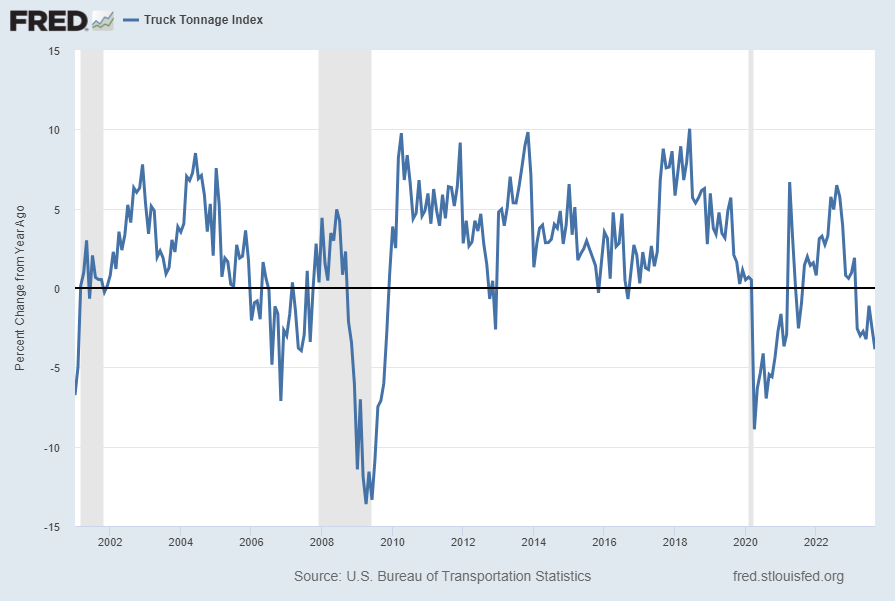
Below is this measure displayed on a “Percent Change From Year Ago” basis with value -3.9%:
source: U.S. Bureau of Transportation Statistics, Truck Tonnage Index [TRUCKD11], retrieved from FRED, Federal Reserve Bank of St. Louis; accessed December 6, 2023: https://fred.stlouisfed.org/series/TRUCKD11
__
Net Percentage of Domestic Banks Reporting Stronger Demand for Commercial and Industrial Loans from Large and Middle-Market Firms (DRSDCILM)
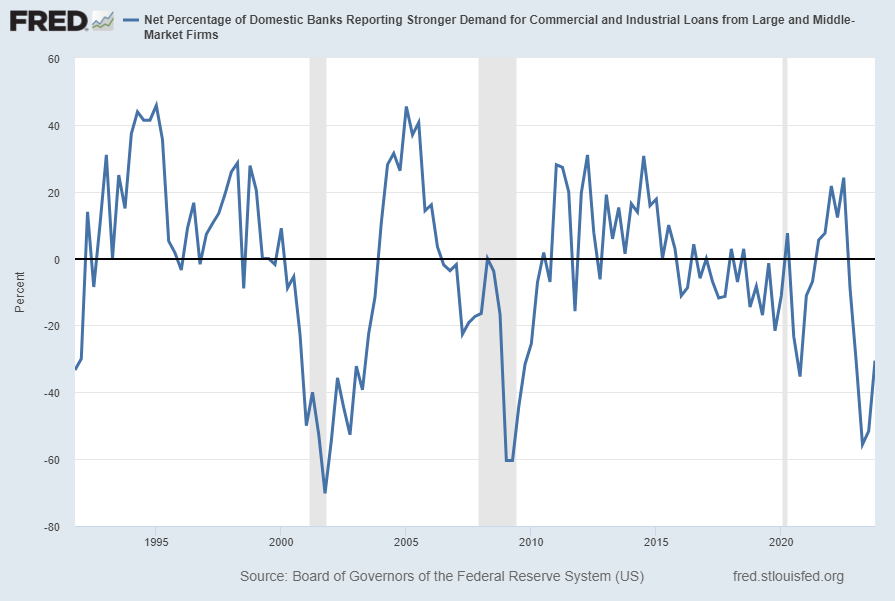
“The Net Percentage of Domestic Banks Reporting Stronger Demand for Commercial and Industrial Loans from Large and Middle-Market Firms” measure has been notably weak. The current value is -30.5% as of the November 6, 2023 quarterly update:
source: Board of Governors of the Federal Reserve System (US), Net Percentage of Domestic Banks Reporting Stronger Demand for Commercial and Industrial Loans from Large and Middle-Market Firms [DRSDCILM] , retrieved from FRED, Federal Reserve Bank of St. Louis; accessed December 6, 2023: https://fred.stlouisfed.org/series/DRSDCILM
__
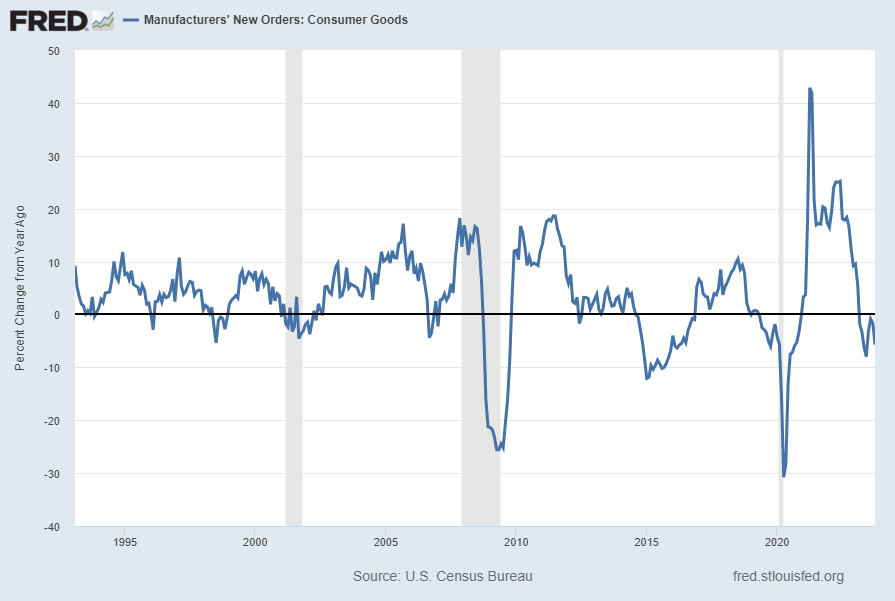
Value of Manufacturers’ New Orders for Consumer Goods Industries (ACOGNO)
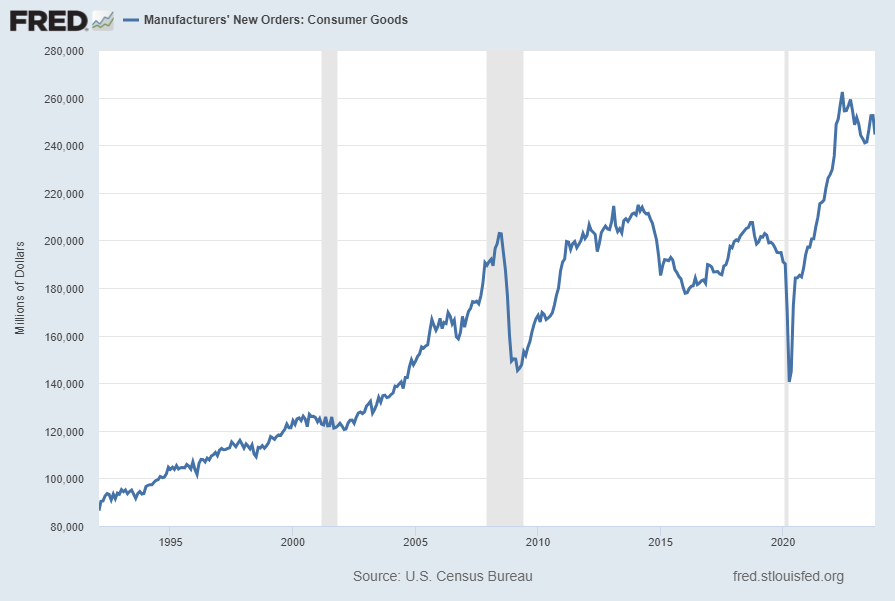
A measure for consumer goods exhibiting a recent peak is the “Value of Manufacturers’ New Orders for Consumer Goods Industries” (ACOGNO). Shown below is this measure with last value of 244,490 ($ Millions) through October 2023 (last updated December 4, 2023):
Displayed below is this same ACOGNO measure on a “Percent Change From Year Ago” basis with value -5.7%:
source: U.S. Census Bureau, Value of Manufacturers’ New Orders for Consumer Goods Industries [ACOGNO], retrieved from FRED, Federal Reserve Bank of St. Louis; accessed December 6, 2023: https://fred.stlouisfed.org/series/ACOGNO
__
Other Indicators
As mentioned previously, many other indicators discussed on this site indicate weak economic growth or economic contraction, if not outright (gravely) problematical economic conditions.
_____
The Special Note summarizes my overall thoughts about our economic situation