Tuesday, February 14, 2012

Philadelphia Fed – 1st Quarter 2012 Survey Of Professional Forecasters


The Philadelphia Fed First Quarter 2012 Survey of Professional Forecasters was released on February 10.  This survey is somewhat unique in various regards, such as it incorporates a longer time frame for various measures.

The survey shows, among many measures, the following expectations:

GDP: (annual average level)
full-year 2012 : 2.3%
full-year 2013 : 2.7%
full-year 2014 : 3.0%
full-year 2015:  3.1%

Unemployment Rate: (annual average level)
for 2012: 8.3%
for 2013: 7.9%
for 2014: 7.4%
for 2015: 6.7%

-

As for “the chance of a contraction in real GDP in any of the next four quarters,” estimates range from 9.5-15.8% for each of the quarters through Q1 2013.

As well, there are also a variety of time frames shown (present through the year 2021) with the expected inflation of each.  Inflation is measured in Headline and Core CPI and Headline and Core PCE.  Over all time frames expectations are shown to be in the 1.6-2.5% range.

_____

I post various economic forecasts because I believe they should be carefully monitored.  However, as those familiar with this blog are aware, I do not agree with many of the consensus estimates and much of the commentary in these forecast surveys.

_____

The Special Note summarizes my overall thoughts about our economic situation

SPX at 1345.61 as this post is written

The February 2012 Wall Street Journal Economic Forecast Survey


The February Wall Street Journal Economic Forecast Survey was published on February 13, 2012.  The headline is “Rosier View Has Familiar Ring.”

The commentary largely focuses on the economic forecasts of 2011 and their accuracy, as well as thoughts as to the economic characteristics of 2012.  Additionally, within the article was a link that detailed how the economists were ranked for their 2011 predictions.

While I found many aspects of the article to be interesting, here are the excerpts I found most notable:
Economists, once bitten, are being cautious this time around. In The Wall Street Journal's latest forecasting survey, conducted this month, economists predicted only modestly faster growth this year than last. They expect gross domestic product to increase 2.5% this year, up from the 1.6% it grew in 2011. That's their strongest expectation in five months, but it still represents slower growth than they predicted a year ago.
also:
The 49 economists who participated in the latest Journal survey—not all answered every question—put the odds of a recession in the next year at just 16%, down from a 33% chance as recently as September.
Also, as seen in the Q&A section (in the spreadsheet), there were various questions.  Perhaps the most interesting was titled "Forecast Risks," which included the question "Is the risk to your 2012 forecast more to the upside or downside?", to which 60% responded to the upside and 40% to the downside.

–

The current average forecasts among economists polled include the following:

GDP:
full-year 2012:  2.5%
full-year 2013:  2.7%
full-year 2014:  3.1%

Unemployment Rate:
December 2012: 8.0%
December 2013: 7.4%
December 2014:  6.8%

10-Year Treasury Yield:
December 2012: 2.62%
December 2013: 3.28%
December 2014:  3.80%

CPI:
December 2012:  2.2%
December 2013:  2.4%
December 2014:  2.6%

Crude Oil  ($ per bbl):
for 12/31/2012: $97.17

(note: I comment upon this WSJ Economic Forecast survey each month; commentary on past surveys can be found under the “Economic Forecasts” label)
_____

I post various economic forecasts because I believe they should be carefully monitored.  However, as those familiar with this blog are aware, I do not necessarily agree with many of the consensus estimates and much of the commentary in these forecast surveys.
_____

The Special Note summarizes my overall thoughts about our economic situation

SPX at 1351.77 as this post is written

Monday, February 13, 2012

Consumer Confidence Surveys – As Of 2-13-12


In the last post ("4 Confidence Charts – February 13, 2012 Update") I displayed four charts indicating various long-term consumer and small business confidence readings as compared to the S&P500.

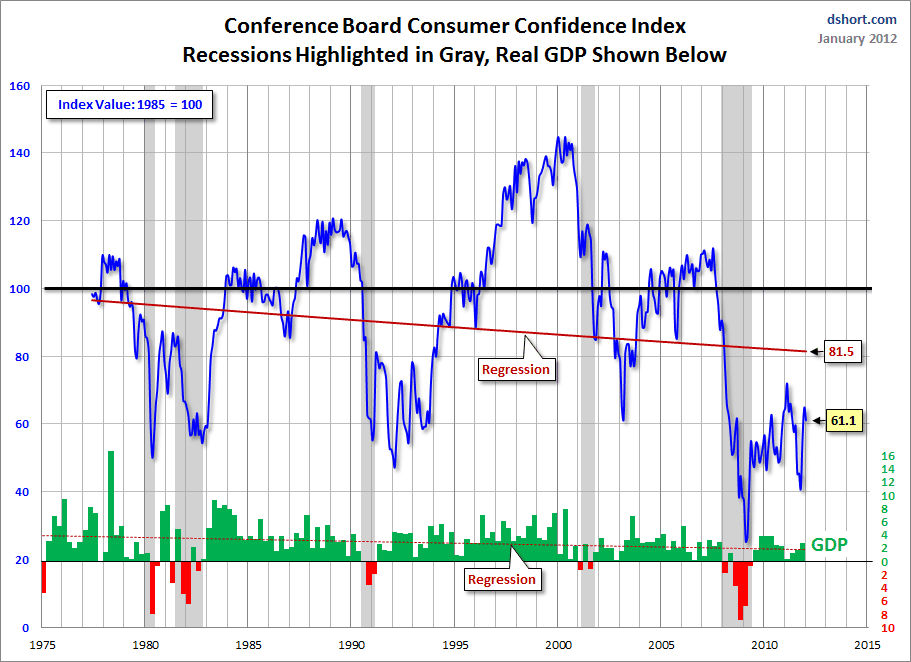
Doug Short had a blog post of February 10 ("Michigan Consumer Sentiment Declines in Preliminary Survey") in which he presents the Conference Board and University of Michigan charts in a different fashion.  They are presented below:

(click on charts to enlarge images)


-


-

There are a few aspects of the above charts that I find highly noteworthy.  Of course, the continuing very subdued absolute levels of these two surveys is disconcerting.

Also, I find the “behavior” of these readings to be quite disparate as compared to the other post-recession periods, as shown in the charts between the gray shaded areas (the gray areas denote recessions as defined by the NBER.)

While I don’t believe that confidence surveys should be overemphasized, I find these readings to be very problematical, especially in light of a variety of other highly disconcerting measures highlighted in this blog.
_____

The Special Note summarizes my overall thoughts about our economic situation

SPX at 1342.64 as this post is written

4 Confidence Charts – February 13, 2012 Update


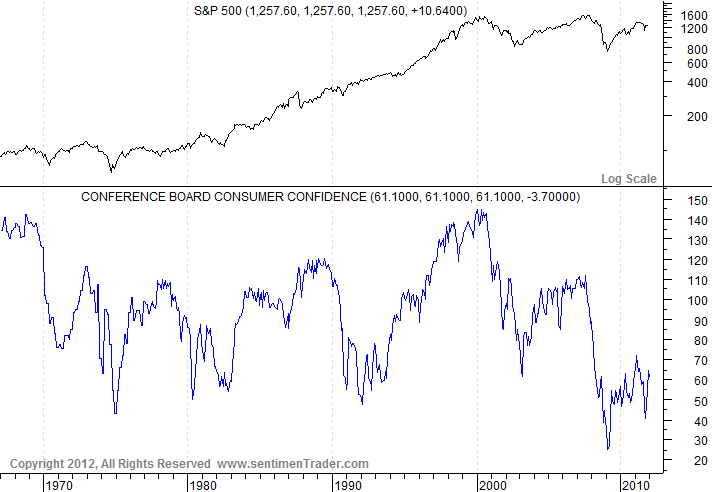
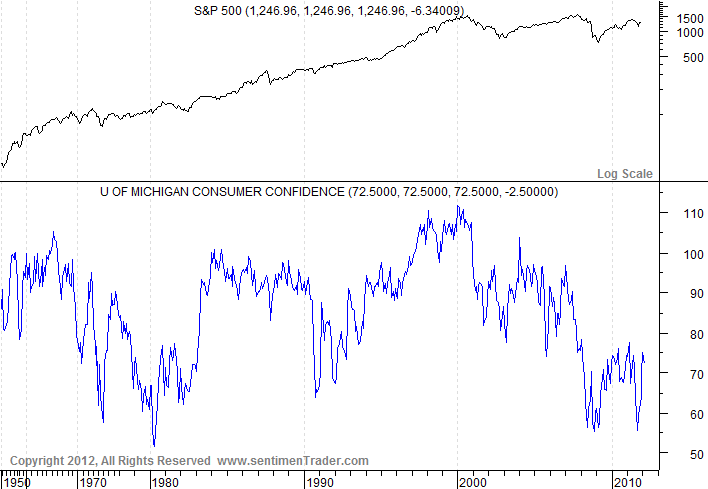
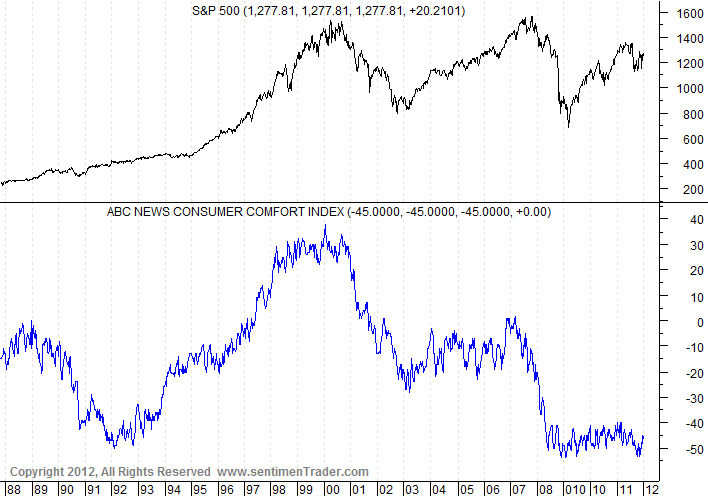
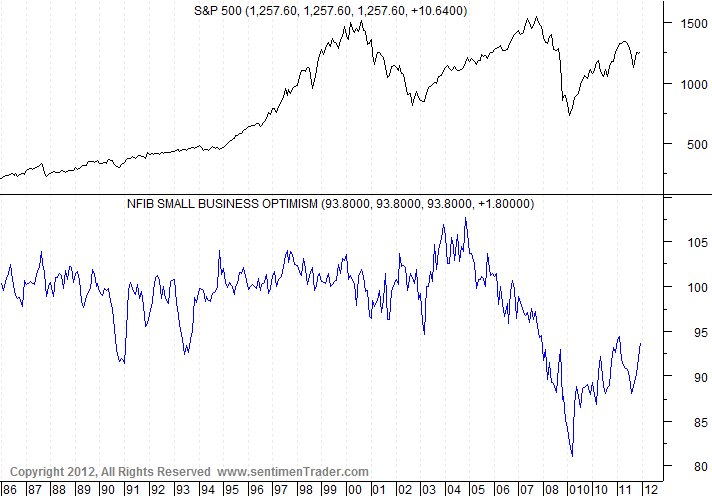
Here are four charts reflecting confidence survey readings.  These are from the SentimenTrader.com site.

I find these charts valuable as they provide a long-term history of each survey, which is rare.

Each survey chart is plotted in blue, below the S&P500:

(click on each chart to enlarge image)

Conference Board Consumer Confidence, last updated 1-31-12:


-

Thomson/Reuters University of Michigan Consumer Sentiment Index, last updated 2-10-12:


-

Bloomberg Consumer Comfort Index (formerly the ABC News Consumer Comfort Index) last updated 1-16-12:


-

NFIB Small Business Optimism, last updated 1-16-12:


-
As one can see, these charts continue to show subdued readings, especially when viewed from a long-term perspective.

These charts should be interesting to monitor going forward.  Although I don’t believe that confidence surveys should be overemphasized, they do help to delineate how the economic environment is being perceived.
_____

The Special Note summarizes my overall thoughts about our economic situation

SPX at 1342.64 as this post is written

Sunday, February 12, 2012

Long-Term Charts Of The ECRI WLI & ECRI WLI, Gr. - February 10, 2012 Update


As I stated in my July 12, 2010 post ("ECRI WLI Growth History"):
For a variety of reasons, I am not as enamored with ECRI’s WLI and WLI Growth measures as many are.
However, I do think the measures are important and deserve close monitoring and scrutiny.
The movement of the ECRI WLI and WLI, Gr. is particularly notable at this time, as ECRI publicly announced on September 30 that the U.S. was “tipping into recession.”  I featured excerpts from their statement in the October 3 post ("ECRI Recession Statement Of September 30 – Notable Excerpts")

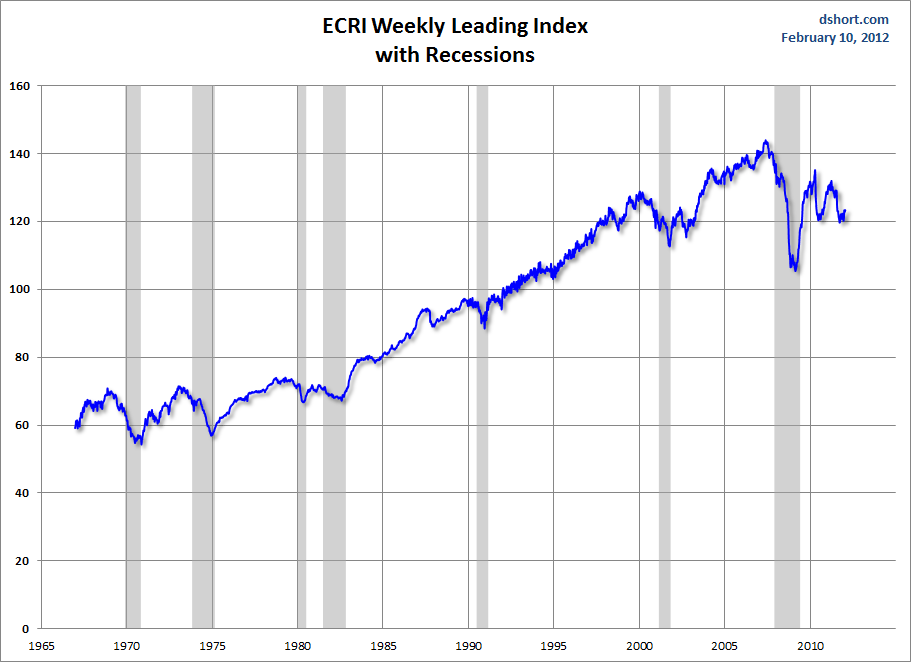
Below is a long-term chart, on a weekly basis through February 10, of the ECRI WLI (defined at ECRI’s glossary) from Doug Short’s blog post of February 10 titled “ECRI's Puzzling Recession Call:  The Growth Index Contraction Eases Yet Again” :

(click on charts to enlarge images)


-

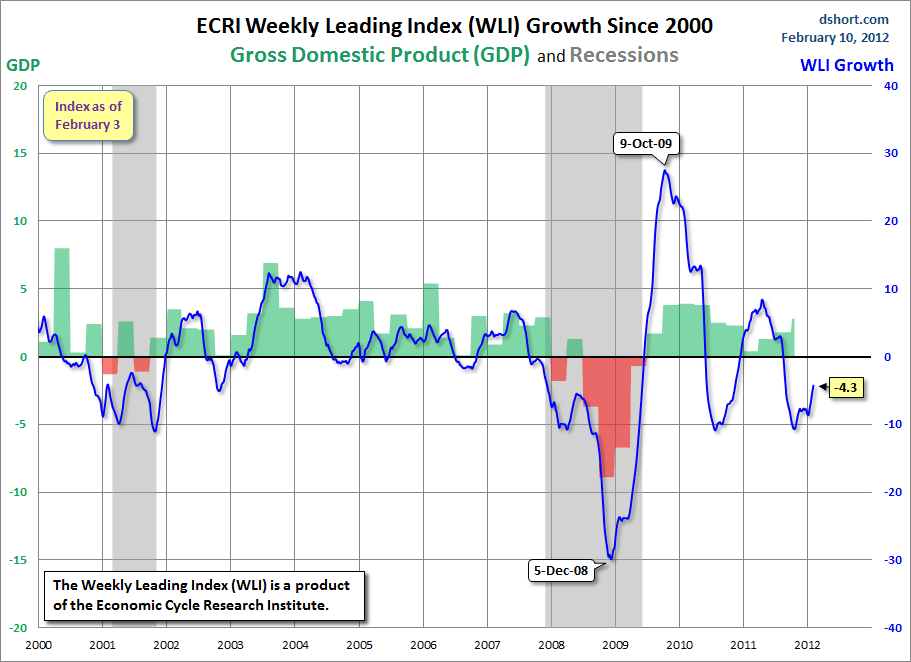
This next chart depicts, on a long-term basis, the WLI, Gr. through February 10:


_________

I post various indicators and indices because I believe they should be carefully monitored.  However, as those familiar with this blog are aware, I do not necessarily agree with what they depict or imply.
_____

The Special Note summarizes my overall thoughts about our economic situation

SPX at 1342.64 as this post is written

Friday, February 10, 2012

St. Louis Financial Stress Index – February 9, 2012 Update


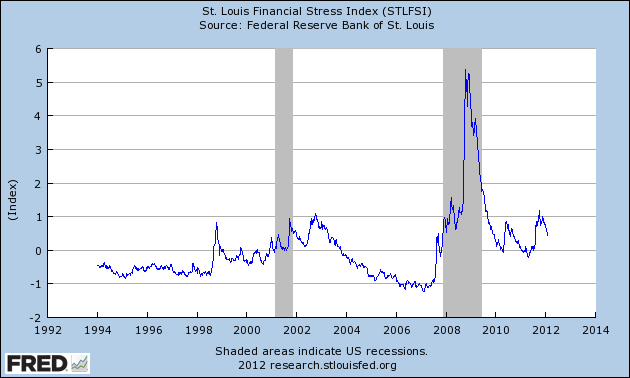
On March 28, 2011 I wrote a post ("The STLFSI") about the  STLFSI (St. Louis Fed’s Financial Stress Index) which is supposed to measure stress in the financial system.  For reference purposes, the most recent chart is seen below.  This chart was last updated on February 9, incorporating data from 12-31-93 to 2-3-12 on a weekly basis.  The present level is .435 :


_________

I post various indicators and indices because I believe they should be carefully monitored.  However, as those familiar with this blog are aware, I do not necessarily agree with what they depict or imply.
_____

The Special Note summarizes my overall thoughts about our economic situation

SPX at 1340.76 as this post is written

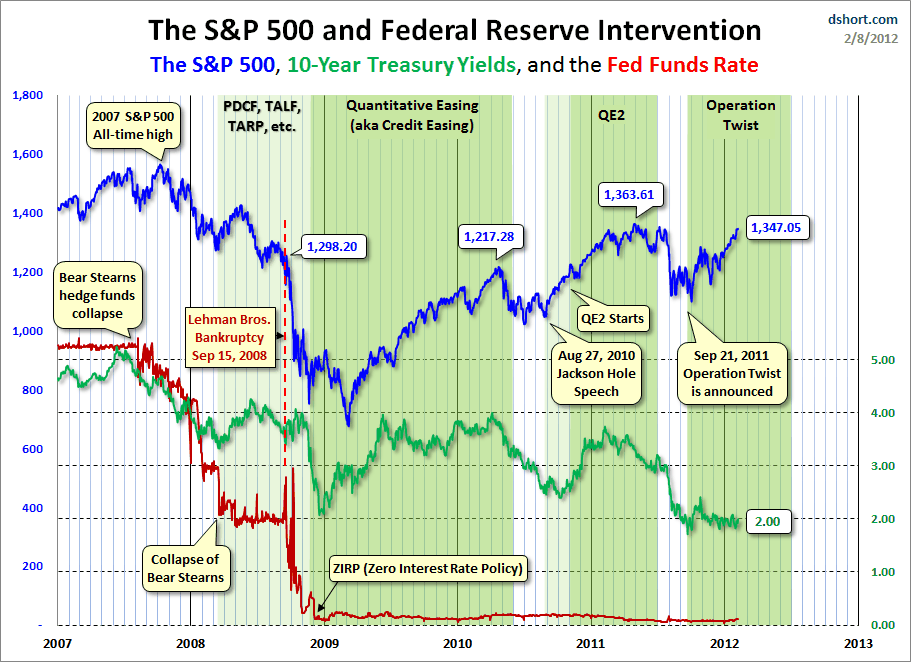
Markets During Periods Of Federal Reserve Intervention – Chart Since 2007


In the August 9, 2011 post ("QE3 – Various Thoughts") I posted a chart that depicted the movements of the S&P500, 10-Year Treasury Yield and the Fed Funds rate spanning the periods of various Federal Reserve interventions since 2007.

For reference purposes, here is an updated chart from Doug Short’s blog post of February 8 ("Fed Intervention and the Market - A New Update") :

(click on chart to enlarge image)


_____

The Special Note summarizes my overall thoughts about our economic situation

SPX at 1351.95 as this post is written

Thursday, February 9, 2012

February 7 Gallup Poll On Economic Confidence – Notable Excerpts


On February 7, Gallup released a poll titled “U.S. Economic Confidence Climbs for Fifth Straight Month.”

A few notable excerpts:
Americans' confidence in the economy improved for the fifth month in a row in January, with Gallup's Economic Confidence Index reaching -27, its highest point since May of last year. Americans, however, are not yet as confident as they were a year ago.
also:
Americans' confidence in the economy has been improving every month since August, when it hit recession levels, plummeting to -52 after the heated battle over the federal debt ceiling in Washington, and Standard and Poor's subsequent Aug. 5 downgrading of the nation's credit rating.
also:
Economic confidence among upper-income Americans had sunk below that of middle- and lower-income Americans in August. However, it has since recovered, and again is better than that of their lower-income counterparts -- as is typical.
_____

The Special Note summarizes my overall thoughts about our economic situation

SPX at 1349.96 as this post is written