Monday, November 17, 2014

Philadelphia Fed – 4th Quarter 2014 Survey Of Professional Forecasters

The Philadelphia Fed Fourth Quarter 2014 Survey of Professional Forecasters was released on November 17, 2014.  This survey is somewhat unique in various regards, such as it incorporates a longer time frame for various measures.
The survey shows, among many measures, the following median expectations:
Real GDP: (annual average level)
full-year 2014 : 2.2%
full-year 2015:  3.0%
full-year 2016:  2.9%
full-year 2017:  2.7%
Unemployment Rate: (annual average level)
for 2014: 6.2%
for 2015: 5.6%
for 2016: 5.4%
for 2017: 5.2%
-
As for “the chance of a contraction in real GDP” in any of the next few quarters, mean estimates are 8.1%, 10.3%, 11.4%, 12.6% and 13.5% for each of the quarters from Q4 2014 through Q4 2015, respectively.
As well, there are also a variety of time frames shown (present quarter through the year 2023) with the median expected inflation (annualized) of each.  Inflation is measured in Headline and Core CPI and Headline and Core PCE.  Over all time frames expectations are shown to be in the 1.0%-2.3% range.
_____
I post various economic forecasts because I believe they should be carefully monitored.  However, as those familiar with this blog are aware, I do not agree with many of the consensus estimates and much of the commentary in these forecast surveys.
_____
The Special Note summarizes my overall thoughts about our economic situation
SPX at 2046.18 as this post is written

Friday, November 14, 2014

Long-Term Charts Of The ECRI WLI & ECRI WLI, Gr. – November 14, 2014 Update

As I stated in my July 12, 2010 post (“ECRI WLI Growth History“):
For a variety of reasons, I am not as enamored with ECRI’s WLI and WLI Growth measures as many are.
However, I do think the measures are important and deserve close monitoring and scrutiny.
The movement of the ECRI WLI and WLI, Gr. is particularly notable at this time, as ECRI publicly announced on September 30, 2011 that the U.S. was “tipping into recession,” and ECRI has reiterated the view that the U.S. economy is currently in a recession, seen most recently in these twelve publicly available sources :
Other past notable year 2012 reaffirmations of the September 30, 2011 recession call by ECRI were seen (in chronological order) on March 15 (“Why Our Recession Call Stands”) as well as various interviews and statements the week of May 6, including:
Also, subsequent to May 2012:
__
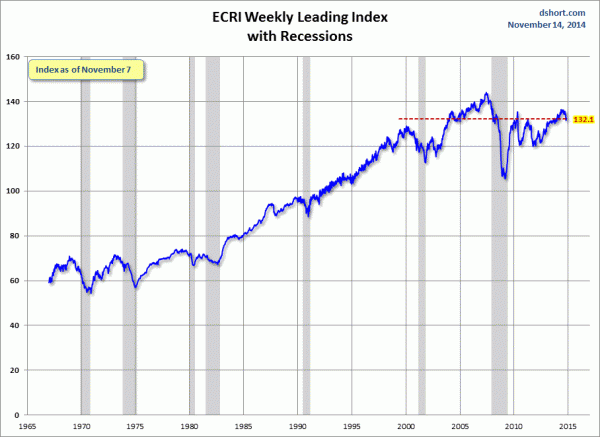
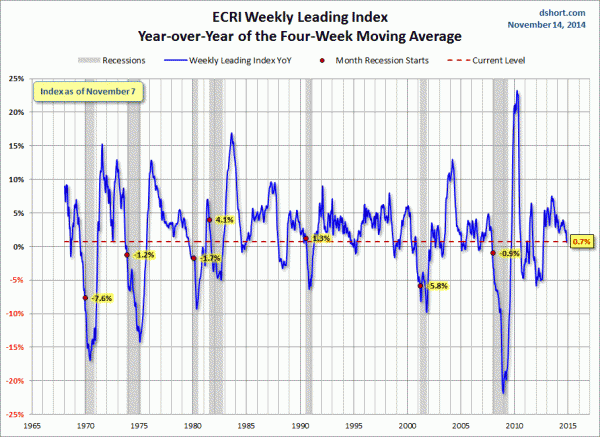
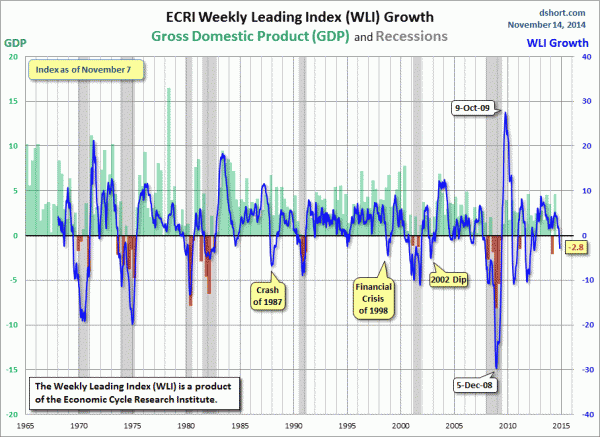
Below are three long-term charts, from Doug Short’s blog post of November 14, 2014 titled “ECRI Recession Watch:  Weekly Update.”  These charts are on a weekly basis through the November 14 release, indicating data through November 7, 2014.
Here is the ECRI WLI (defined at ECRI’s glossary):
ECRI WLI
–
This next chart depicts, on a long-term basis, the Year-over-Year change in the 4-week moving average of the WLI:
Dshort 11-14-14 - ECRI-WLI-YoY .7 percent
–
This last chart depicts, on a long-term basis, the WLI, Gr.:
ECRI WLI,Gr.
_________
I post various economic indicators and indices because I believe they should be carefully monitored.  However, as those familiar with this blog are aware, I do not necessarily agree with what they depict or imply.
_____
The Special Note summarizes my overall thoughts about our economic situation
SPX at 2037.52 as this post is written

Broad-Based Indicators Of Economic Activity

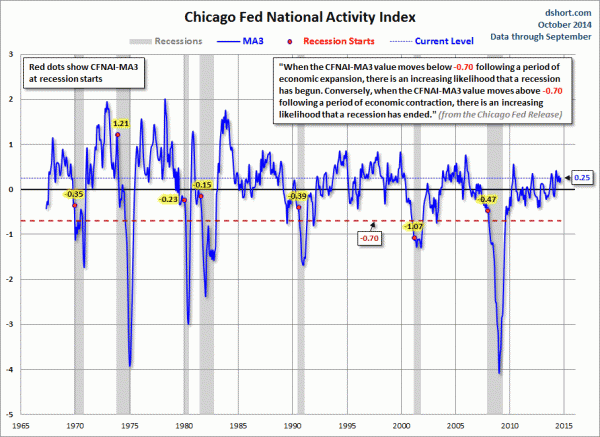
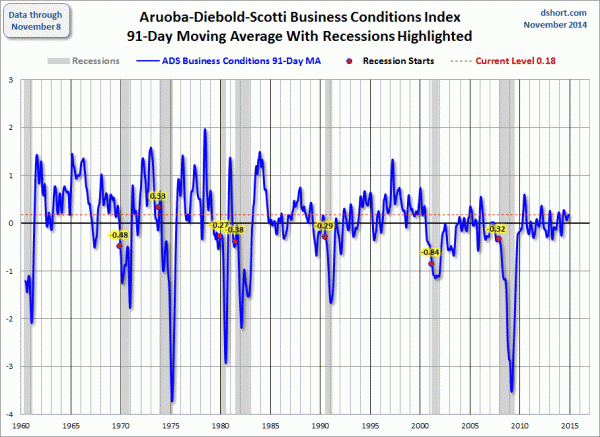
The Chicago Fed National Activity Index (CFNAI) and the Aruoba-Diebold-Scotti Business Conditions Index (ADS Index) are two broad-based economic indicators that I regularly feature in this site.
The short-term and long-term trends of each continue to be notable.
Doug Short, in his blog post of November 14, 2014, titled “The Philly Fed ADS Business Conditions Index” displays both the CFNAI MA-3 (3-month Moving Average) and ADS Index (91-Day Moving Average) from a variety of perspectives.
Of particular note, two of the charts, shown below, denote where the current levels of each reading is relative to the beginning of past recessionary periods, as depicted by the red dots.
The CFNAI MA-3:
(click on charts to enlarge images)
CFNAI
–
The ADS Index, 91-Day MA:
ADS Index 91-day
–
Also shown in the Doug Short’s aforementioned post is a chart of each with a long-term trendline (linear regression) as well as a chart depicting GDP for comparison purposes.
_________
I post various indicators and indices because I believe they should be carefully monitored.  However, as those familiar with this blog are aware, I do not necessarily agree with what they depict or imply.
_____
The Special Note summarizes my overall thoughts about our economic situation
SPX at 2037.35 as this post is written

Thursday, November 13, 2014

The November 2014 Wall Street Journal Economic Forecast Survey

The November Wall Street Journal Economic Forecast Survey was published on November 13, 2014.  The headline is “Economists' View:  Lower Inflation, Decent Growth.”
I found numerous items to be notable – although I don’t necessarily agree with them – both within the article and in the “Economist Q&A” section.
Two excerpts:
According to the panel of 44 economists—not all of whom answered every question—yearly inflation as measured by the consumer-price index will end 2014 at 1.6%. That’s a sharp shift in just a couple of months. As recently as the September survey, the consensus view was that inflation would accelerate and end the year at 2.1%. Inflation was running at 1.7% in September, the latest Labor Department reading.
also:
Low energy prices will help support a steady but unspectacular expansion through mid-2015, the panelists say. They expect inflation-adjusted gross domestic product to grow at an annualized 2.7% pace this quarter and 2.8% in the first half of 2015. The unemployment rate will drift lower from October’s 5.8%, according to the consensus view of forecasters. They forecast the rate will end 2014 at 5.7% and finish 2015 at 5.3%.
As seen in the “Recession Probability” section, the average response as to the odds of another recession starting within the next 12 months was 11.73%; October’s average response was 11.88%.
–
The current average forecasts among economists polled include the following:
GDP:
full-year 2014:  2.2%
full-year 2015:  2.8%
full-year 2016:  2.8%
Unemployment Rate:
December 2014: 5.7%
December 2015: 5.3%
December 2016: 5.0%
10-Year Treasury Yield:
December 2014: 2.52%
December 2015: 3.34%
December 2016: 3.80%
CPI:
December 2014:  1.6%
December 2015:  2.0%
December 2016:  2.2%
Crude Oil  ($ per bbl):
for 12/31/2014: $78.82
for 12/31/2015: $82.78
(note: I highlight this WSJ Economic Forecast survey each month; commentary on past surveys can be found under the “Economic Forecasts” label)
_____
I post various economic forecasts because I believe they should be carefully monitored.  However, as those familiar with this blog are aware, I do not necessarily agree with many of the consensus estimates and much of the commentary in these forecast surveys.
_____
The Special Note summarizes my overall thoughts about our economic situation
SPX at 2033.38 as this post is written

Chicago Fed National Financial Conditions Index (NFCI)

The St. Louis Fed’s Financial Stress Index (STLFSI) is one index that is supposed to measure stress in the financial system.  Its reading as of the November 13, 2014 update (reflecting data through November 7) is -1.137.
Of course, there are a variety of other measures and indices that are supposed to measure financial stress and other related issues, both from the Federal Reserve as well as from private sources.
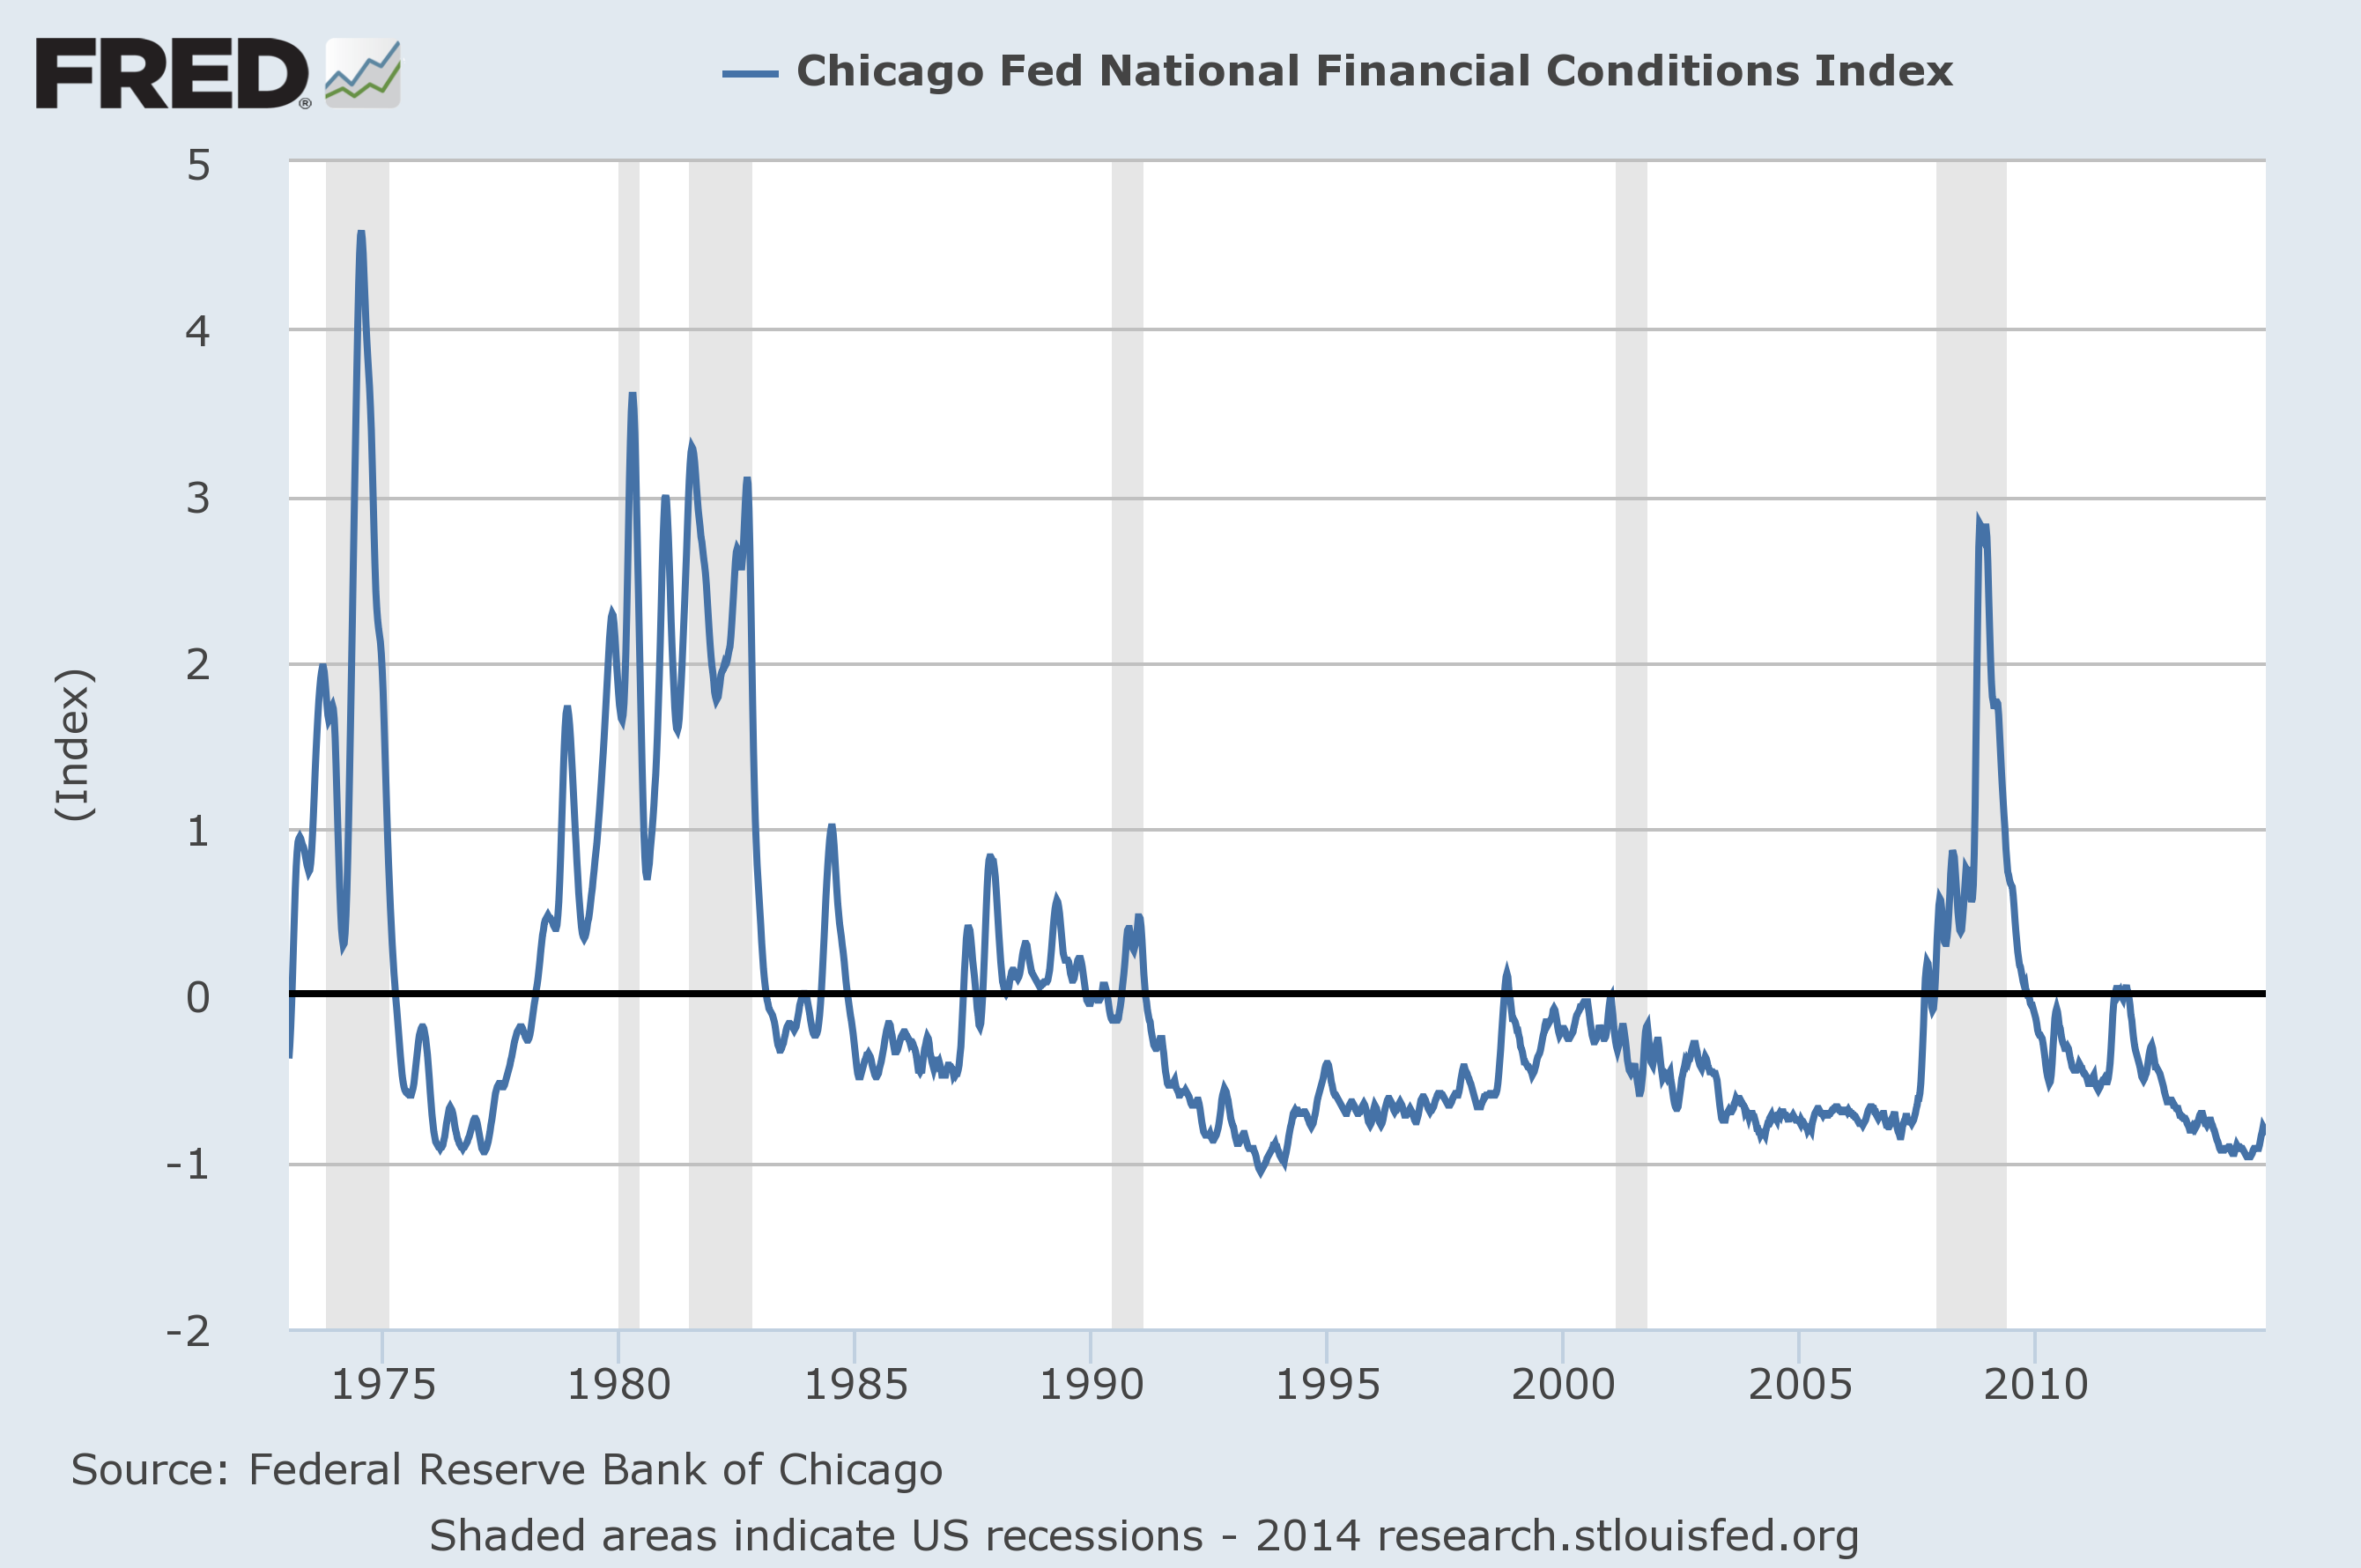
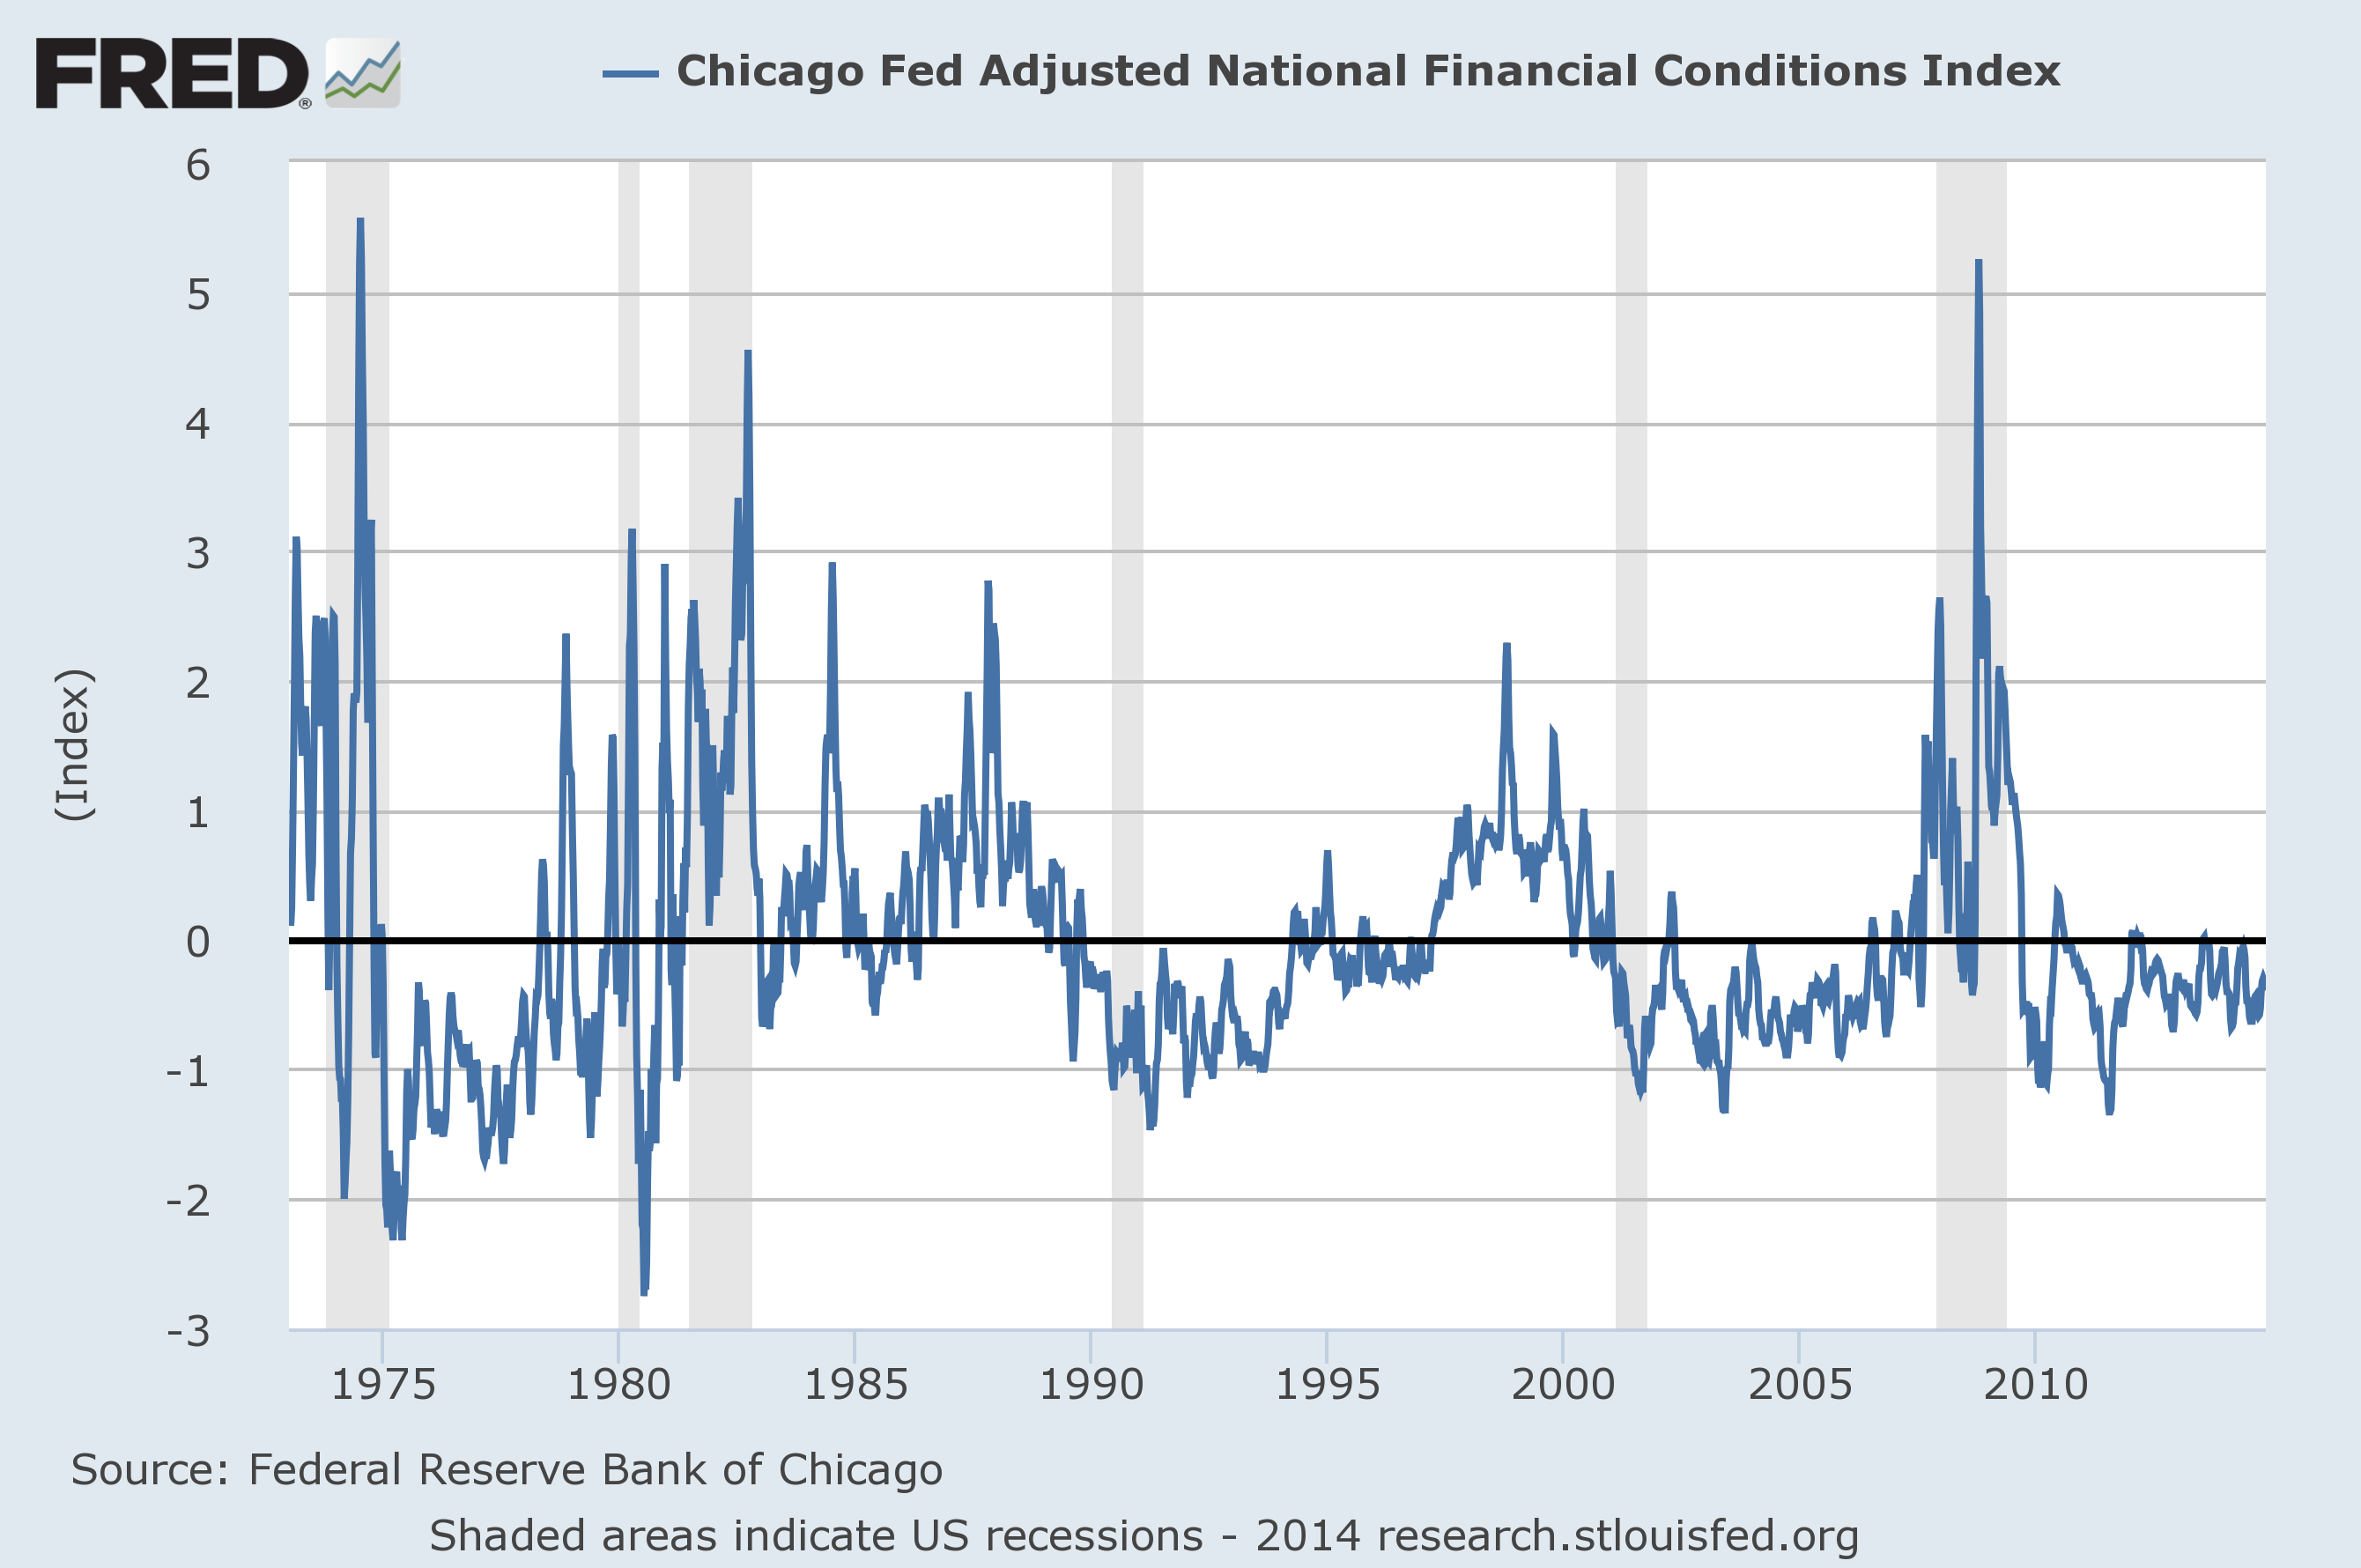
Two other indices that I regularly monitor include the Chicago Fed National Financial Conditions Index (NFCI) as well as the Chicago Fed Adjusted National Financial Conditions Index (ANFCI).
Here are summary descriptions of each, as seen in FRED:
The National Financial Conditions Index (NFCI) measures risk, liquidity and leverage in money markets and debt and equity markets as well as in the traditional and “shadow” banking systems. Positive values of the NFCI indicate financial conditions that are tighter than average, while negative values indicate financial conditions that are looser than average.
The adjusted NFCI (ANFCI). This index isolates a component of financial conditions uncorrelated with economic conditions to provide an update on how financial conditions compare with current economic conditions.
For further information, please visit the Federal Reserve Bank of Chicago’s web site:
Below are the most recently updated charts of the NFCI and ANFCI, respectively.
The NFCI chart below was last updated on November 13, incorporating data from January 5,1973 to November 7, 2014, on a weekly basis.  The November 7, 2014 value is -.84:
(click on chart to enlarge image)
NFCI
Data Source: FRED, Federal Reserve Economic Data, Federal Reserve Bank of St. Louis; accessed November 13, 2014:
–
The ANFCI chart below was last updated on November 13, incorporating data from January 5,1973 to November 7, 2014, on a weekly basis.  The November 7, 2014 value is -.39:
ANFCI
Data Source: FRED, Federal Reserve Economic Data, Federal Reserve Bank of St. Louis; accessed November 13, 2014:
_________
I post various indicators and indices because I believe they should be carefully monitored.  However, as those familiar with this blog are aware, I do not necessarily agree with what they depict or imply.
_____
The Special Note summarizes my overall thoughts about our economic situation
SPX at 2031.09 as this post is written

Walmart’s Q3 2015 Results – Comments

I found various notable items in Walmart’s Q3 2015 management call transcript (pdf) dated November 13, 2014.  (as well, there is Walmart’s press release of the Q3 results)
I view Walmart’s results and comments as particularly noteworthy given their retail prominence and focus on low prices.  I have previously commented on their quarterly management call comments; these previous posts are found under the “paycheck to paycheck” label.
Here are various excerpts that I find most notable:
comments from Greg Foran, president and CEO of Walmart U.S., page 10:
Now, let’s turn to this quarter’s performance. Net sales grew $2.3 billion, or 3.4 percent. For the 13-week period ended October 31, comparable sales were up 0.5 percent. This is the first positive comp for the Walmart U.S. business in 7 quarters, despite approximately 70 basis points of impact from SNAP-related headwinds. Ticket was up 1.2 percent, while traffic declined 0.7 percent. Note that traffic improved 40 basis points from Q2 and 70 basis points from Q1.
comments from Greg Foran, president and CEO of Walmart U.S., page 11:
Shifting to the remainder of our financial results … Gross profit rate declined 22 basis points. This was driven primarily by pharmacy cost inflation and reductions in third-party reimbursement rates. Additionally, we’ve continued price investment in key categories such as meat and preferred Medicare plans in pharmacy.
comments from Greg Foran, president and CEO of Walmart U.S., page 13:
As we enter the fourth quarter, we see both opportunities and challenges ahead of us. We lapped the approximately 6 percent reduction in SNAP benefits on November 1. Additionally, gas prices are considerably lower this year than a year ago, which may give customers a little more discretionary spending power in the coming months. And as I just discussed, we’re enthused by our holiday plans across the box and online. However, we expect this holiday season to be highly competitive, and we’re mindful that the entertainment business, which comprises a larger percentage of overall Q4 sales, is up against continued deflation and a lack of new product innovation. We’ll continue to see pressures to the bottom line as we balance wage leverage with higher customer service standards.
_____
The Special Note summarizes my overall thoughts about our economic situation
SPX at 2042.73 as this post is written

Wednesday, November 12, 2014

Zillow Q4 2014 Home Price Expectations Survey – Summary & Comments

On November 11, 2014, the Zillow Q4 2014 Home Price Expectations Survey results were released.  This survey is done on a quarterly basis.
Two excerpts from the Press Release:
  • More than 100 experts predict U.S. home values to end 2014 up an average of 4.8 percent from 2013, to a median home value of $176,760.
  • Almost 90 percent of respondents with an opinion expect the housing market to fully normalize within five years.
  • In the longer term, panelists are most concerned by would-be first-time buyers in a weak financial position and demographic changes affecting the housing market.
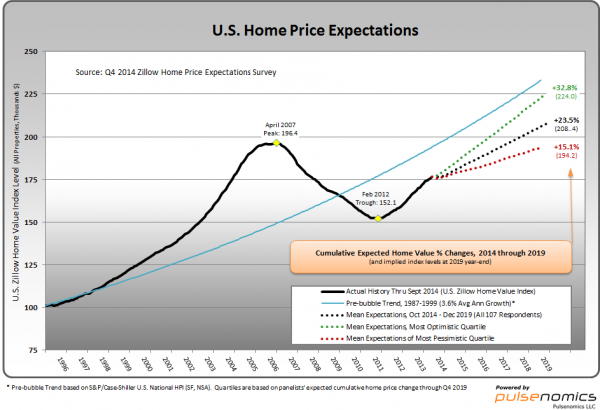
Home values will end 2014 up 4.8 percent year-over-year, and will gain another 23.5 percent in value, cumulatively, through 2019, according to results of the latest Zillow Home Price Expectations Survey.
also:
The panelists said they expect home values to appreciate between 3 and 4 percent annually over the next five years, on average, slowing to an annual rate of 3.2 percent in 2019. Nationally, the median home value is currently $176,500, according to the 2014 Q3 Zillow Real Estate Markets Report, and is projected to cross the $200,000 threshold in September 2018. Home values are expected to rise above their 2007 peak of $196,400 in February 2018.
-
Various Q4 2014 Zillow Home Price Expectations Survey charts are available, including that seen below:
Zillow U.S. Home Price Expectations
As one can see from the above chart, the average expectation is that the residential real estate market, as depicted by the U.S. Zillow Home Value Index, will continually climb.
The detail of the Q4 2014 Home Price Expectations Survey (pdf) is interesting.  Of the 107 survey respondents, only one (of the displayed responses) forecasts a cumulative price decrease through 2019; and even that one does not foresee a double-digit percentage cumulative price drop.  That forecast is from Mark Hanson’s prediction, which foresees a 6.83% cumulative price decrease through 2019.
The Median Cumulative Home Price Appreciation for years 2014-2019 is seen as 5.00%, 8.99%, 12.48%, 15.86%, 19.33%, and 22.91%, respectively.
For a variety of reasons, I continue to believe that even the most “bearish” of these forecasts (as seen in Mark Hanson’s above-referenced forecast) will prove too optimistic in hindsight.  From a longer-term historical perspective, such a decline is very mild in light of the wild excesses that occurred over the “bubble” years.
I have written extensively about the residential real estate situation.  For a variety of reasons, it is exceedingly complex.  While many people continue to have an optimistic view regarding future residential real estate prices, in my opinion such a view is unsupported on an “all things considered” basis.  Furthermore, (even) from these price levels there exists outsized potential for a price decline of severe magnitude, unfortunately.  I discussed this downside, based upon historical price activity, in the October 24, 2010 post titled “What’s Ahead For The Housing Market – A Look At The Charts.”
_____
The Special Note summarizes my overall thoughts about our economic situation
SPX at 2036.10 as this post is written

Tuesday, November 11, 2014

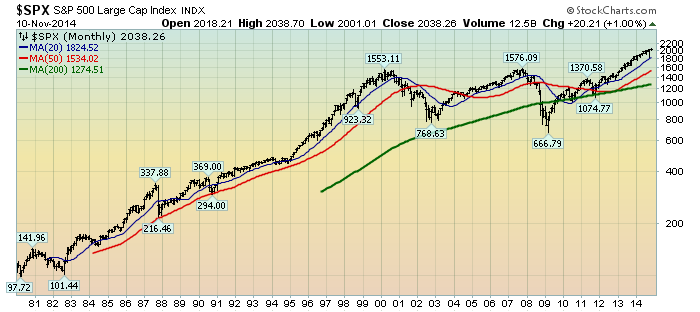
Charts Of Equities’ Performance Since March 9, 2009 And January 1, 1980 – November 11, 2014 Update

In the March 9, 2012 post (“Charts of Equities’ Performance Since March 9, 2009 And January 1, 1980“) I highlighted two charts for reference purposes.
Below are those two charts, updated through the latest daily closing price.
The first is a daily chart of the S&P500 (shown in green), as well as five prominent (AAPL, IBM, WFM, SBUX, CAT) individual stocks, since 2005.  There is a blue vertical line that is very close to the March 6, 2009 low.  As one can see, both the S&P500 performance, as well as many stocks including the five shown, have performed strongly since the March 6, 2009 low:
(click on chart to enlarge image)(chart courtesy of StockCharts.com; chart creation and annotation by the author)
S&P500 and prominent stocks
–
This next chart shows, on a monthly LOG basis, the S&P500 since 1980.  I find this chart notable as it provides an interesting long-term perspective on the S&P500′s performance.  The 20, 50, and 200-month moving averages are shown in blue, red, and green lines, respectively:
(click on chart to enlarge image)(chart courtesy of StockCharts.com; chart creation and annotation by the author)
S&P500 monthly price chart
_____
The Special Note summarizes my overall thoughts about our economic situation
SPX at 2038.26 as this post is written