Friday, June 12, 2015

June 2015 Duke/CFO Magazine Global Business Outlook Survey – Notable Excerpts

On June 5, 2015 the June Duke/CFO Magazine Global Business Outlook Survey (pdf) was released.  It contains a variety of statistics regarding how CFOs view business and economic conditions.
In this CFO Survey, I found the following to be the most notable excerpts:
U.S. companies expect wage hikes of more than 3 percent over the next year, with hiring increasing by more than 2 percent. Wage and employment growth is predicted to be strongest in tech, services and consulting, health care and construction.
“Wage growth expectations the past few quarters have been the highest in the survey since 2007,” said John Graham, a finance professor at Duke’s Fuqua School of Business and director of the survey. “In fact, CFOs indicate that difficulty in hiring and retaining qualified employees is a top three concern, especially in industries like tech and health care.”
also:
U.S. CFOs remain optimistic about the U.S. economy’s outlook. On a scale from zero to 100, they rate the outlook at 63, down from 65 last quarter but still the third highest since 2007. U.S. companies plan to increase capital spending six percent over the next year.
The CFO survey contains two Optimism Index chart, with the bottom chart showing U.S. Optimism (with regard to the economy) at 63, as seen below:
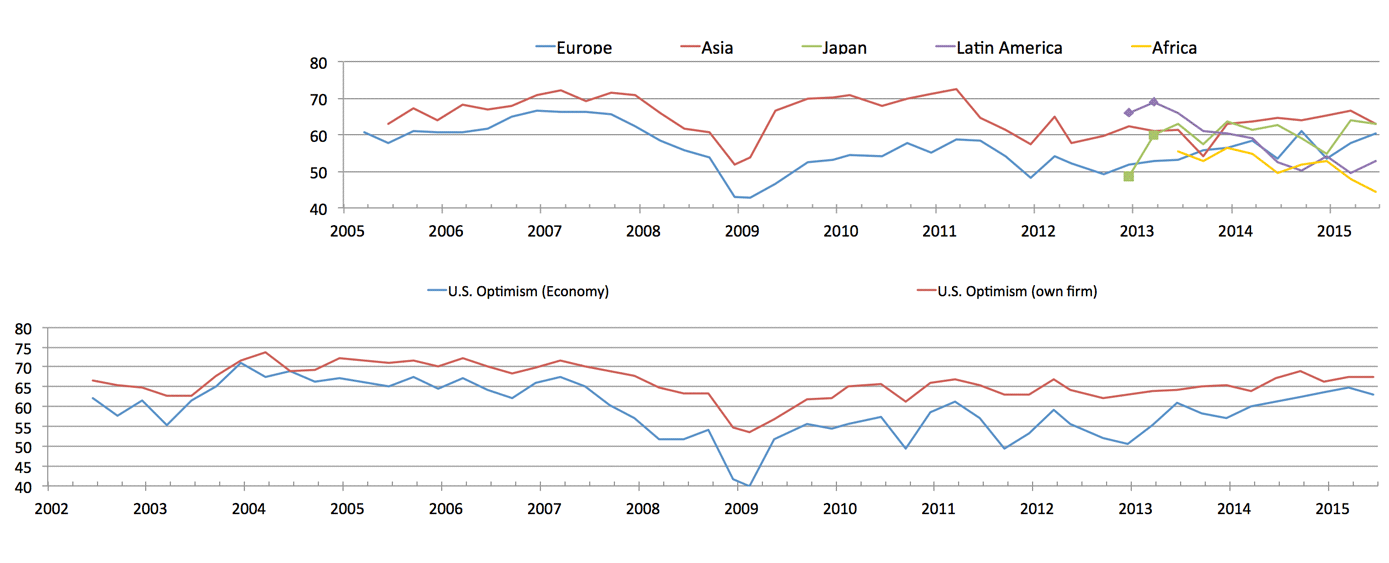
Duke CFO 6-5-15 - optimism_graph
It should be interesting to see how well the CFOs predict business and economic conditions going forward.   I discussed various aspects of this, and the importance of these predictions, in the July 9, 2010 post titled “The Business Environment”.
(past posts on CEO and CFO Surveys can be found under the “CFO and CEO Confidence” tag)
_____
I post various economic forecasts because I believe they should be carefully monitored.  However, as those familiar with this blog are aware, I do not necessarily agree with many of the consensus estimates and much of the commentary in these forecast surveys.
_____
The Special Note summarizes my overall thoughts about our economic situation
SPX at 2095.25 as this post is written

Thursday, June 11, 2015

Total Household Net Worth As Of 1Q 2015 – Two Long-Term Charts

In the last post (“Total Household Net Worth As A Percent Of GDP 1Q 2015“) I displayed a long-term chart depicting Total Household Net Worth as a percentage of GDP.
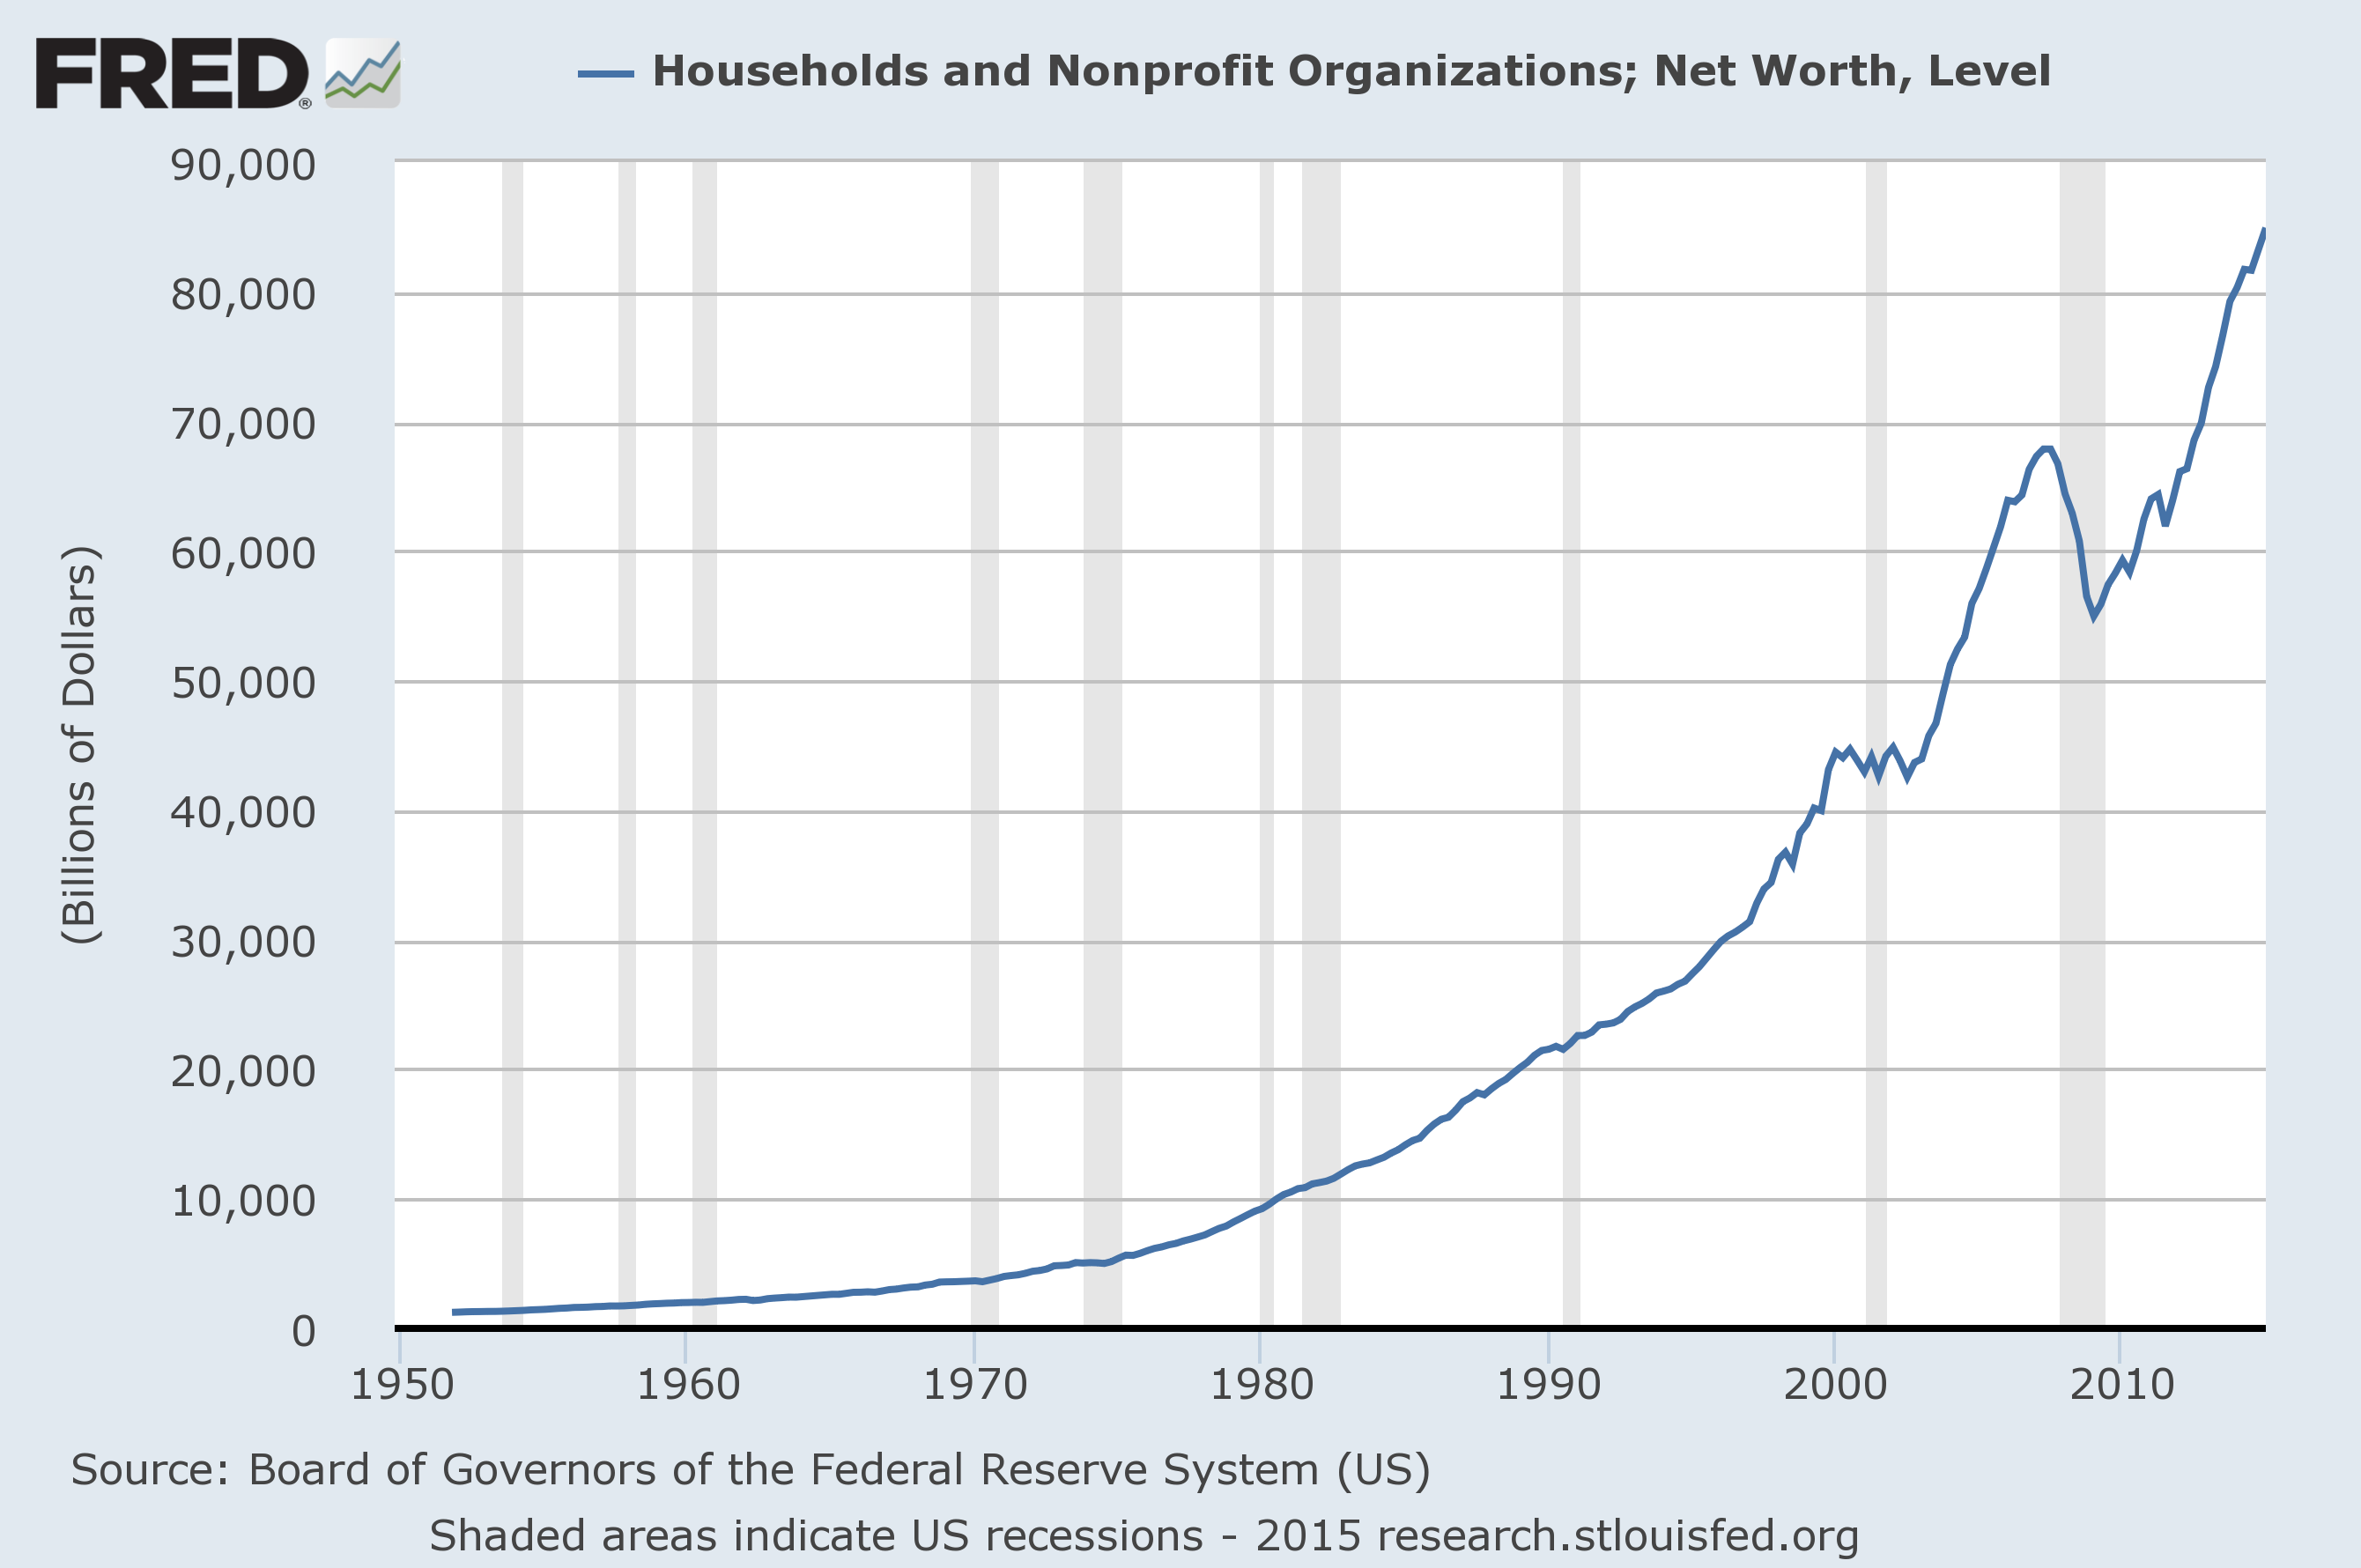
For reference purposes, here is Total Household Net Worth from a long-term perspective (from 1949:Q4 to 2015:Q1).  The last value (as of June 11, 2015) is $84.92465 Trillion:
(click on each chart to enlarge image)
total household net worth
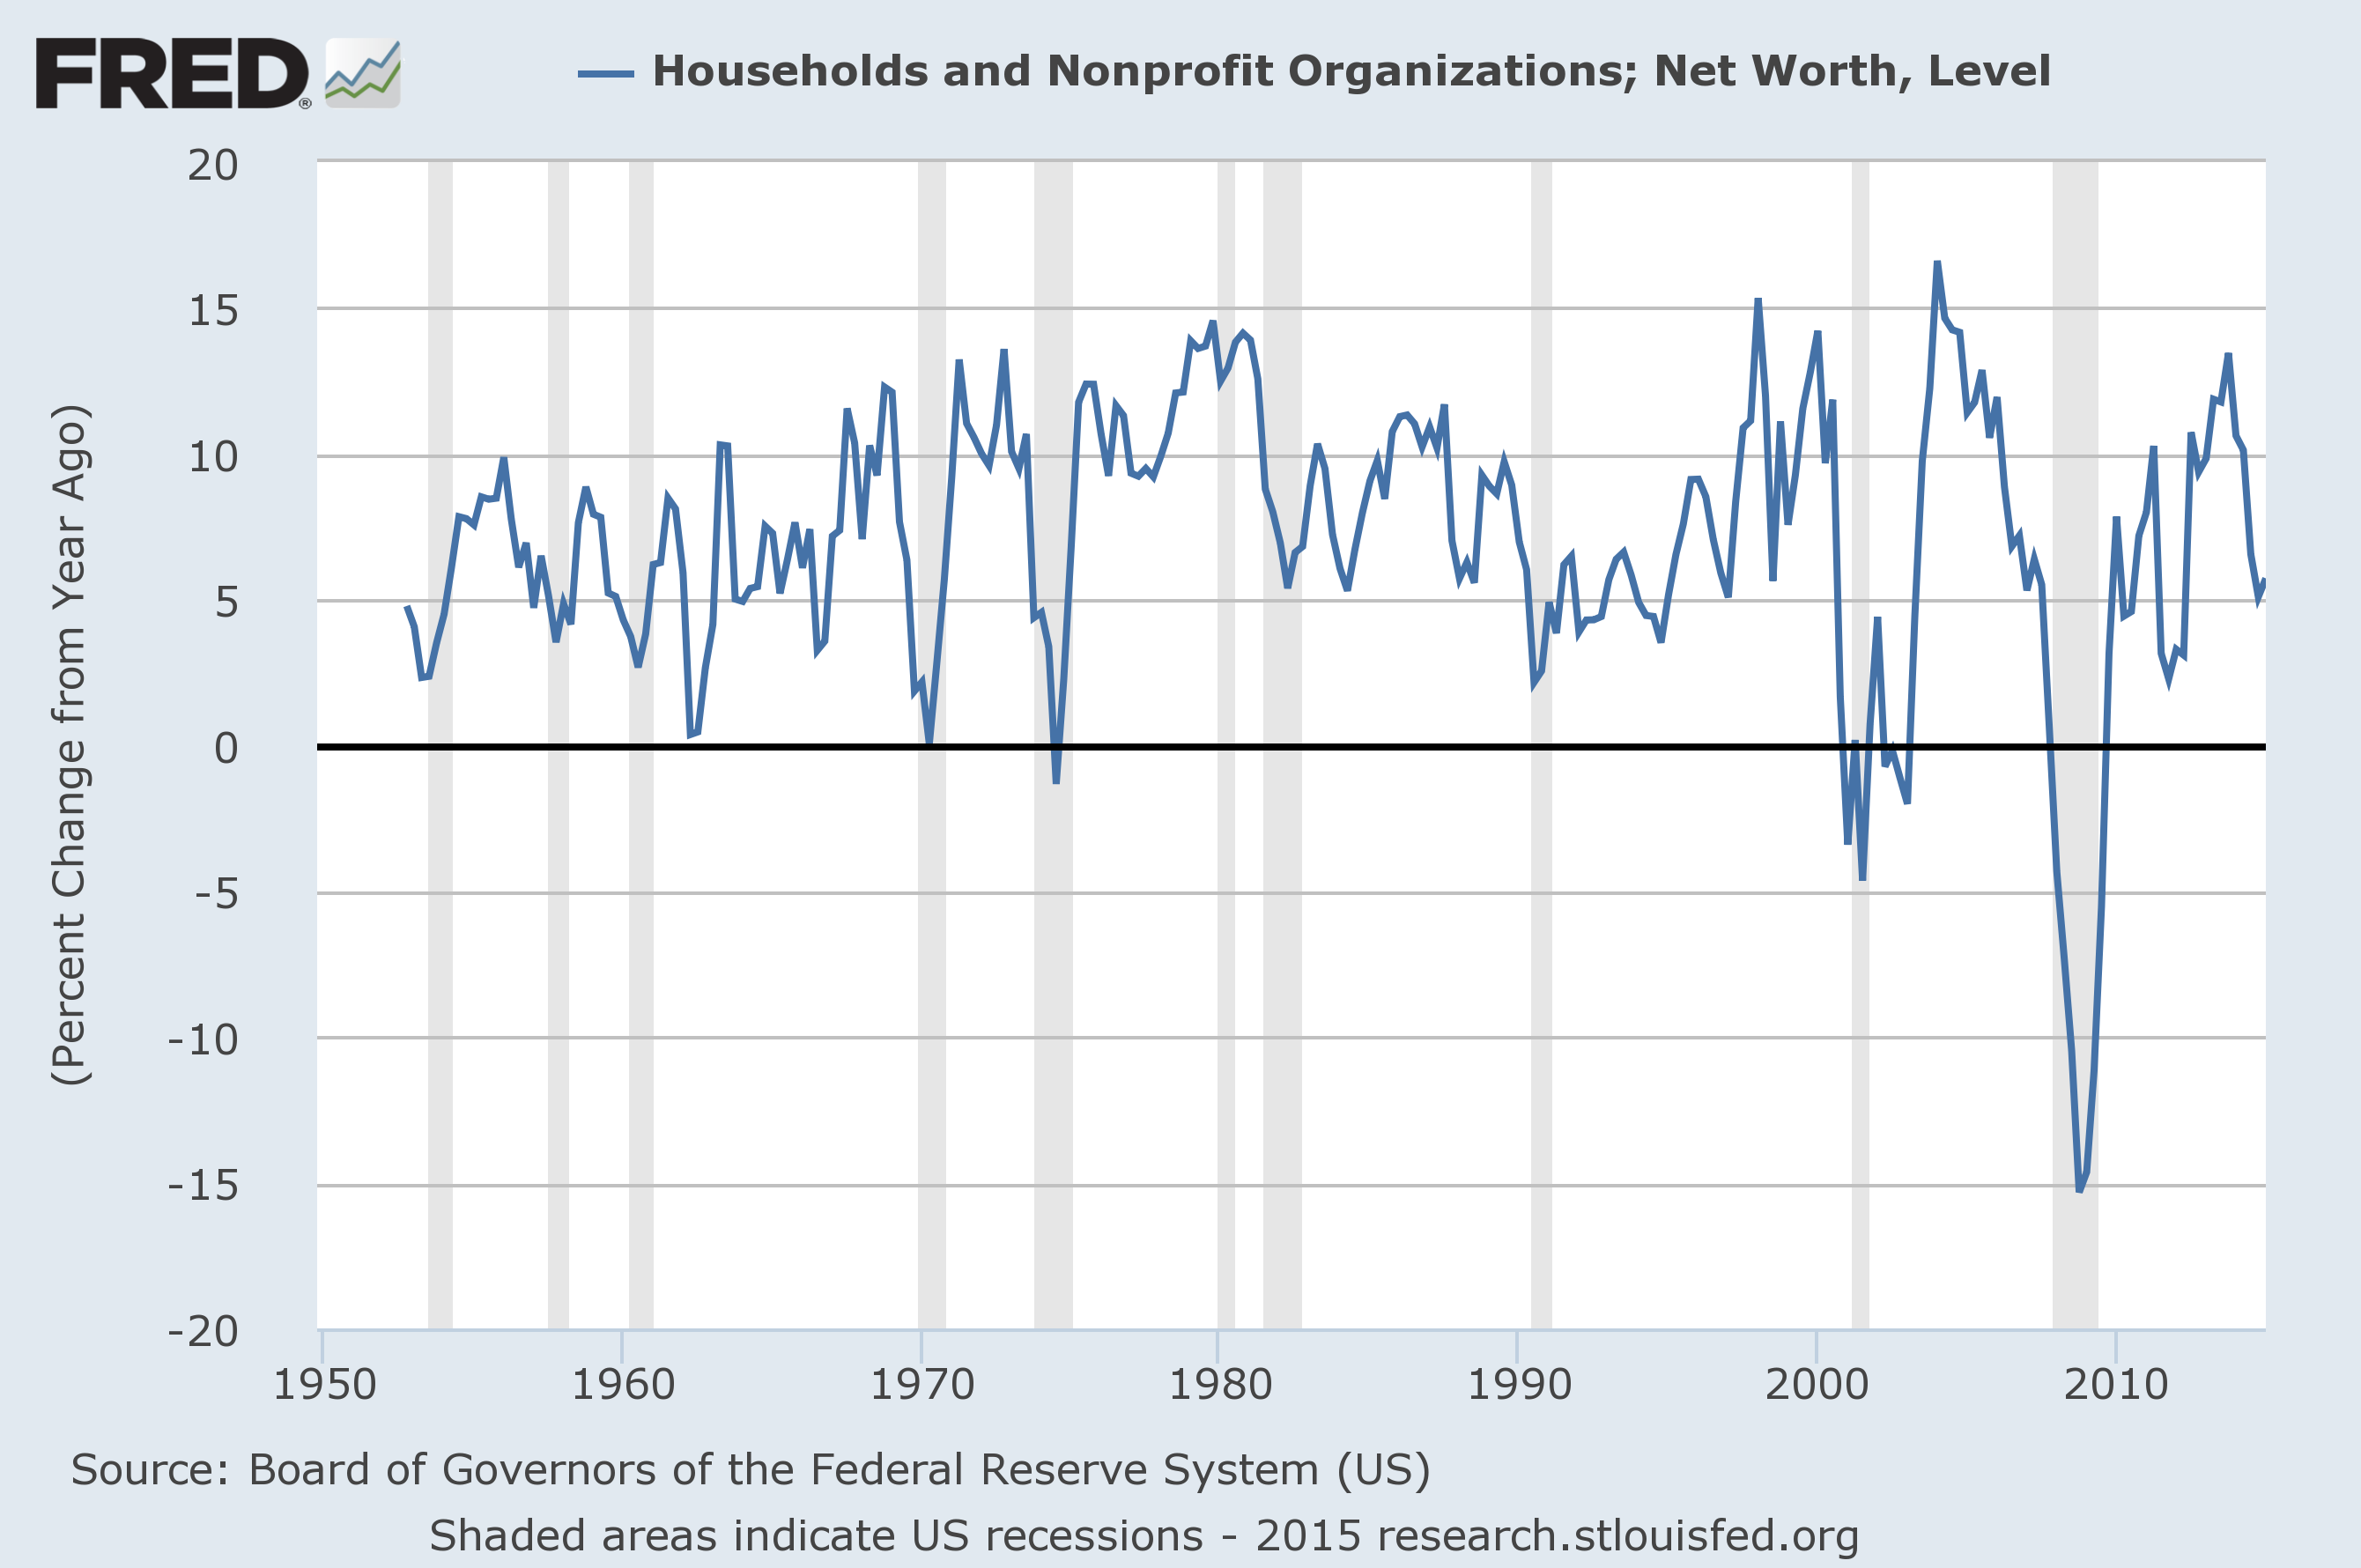
Also of interest is the same metric presented on a “Percent Change from a Year Ago” basis:
Total household net worth percent change from a year ago
Data Source: FRED, Federal Reserve Economic Data, Board of Governors of the Federal Reserve System; accessed June 11, 2015:
_____
The Special Note summarizes my overall thoughts about our economic situation
SPX at 2108.86 as this post is written

Total Household Net Worth As A Percent Of GDP 1Q 2015

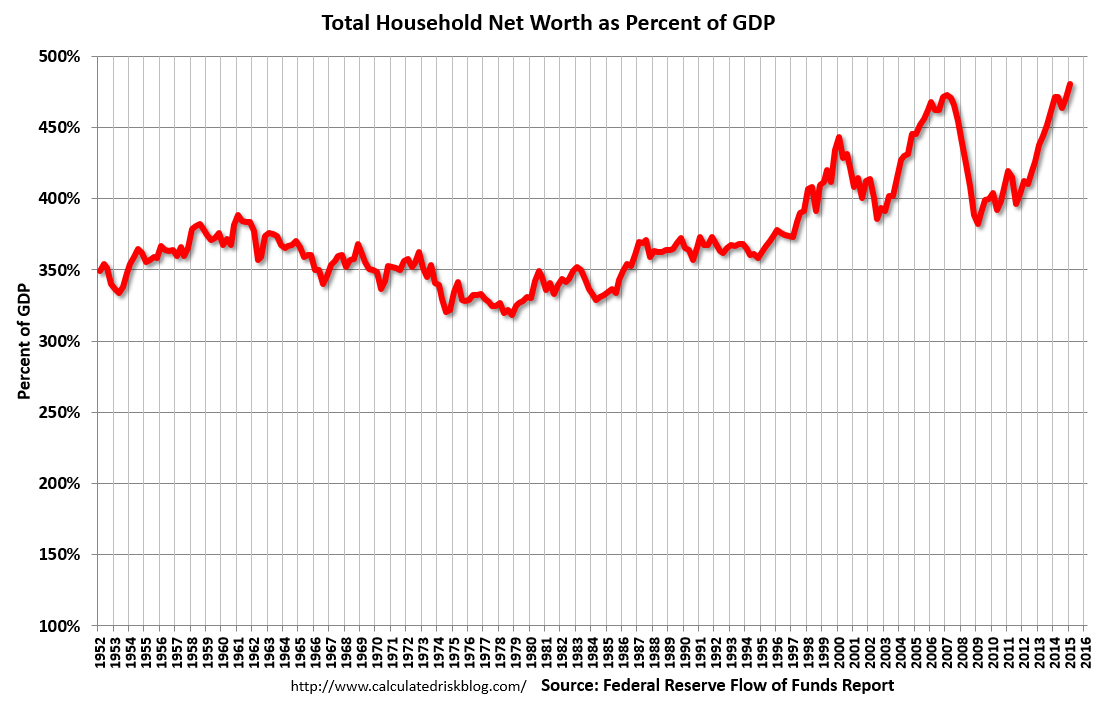
The following chart is from the CalculatedRisk blog post of June 11, 2015 titled “Fed’s Q1 Flow of Funds:  Household Net Worth at Record High.” It depicts Total Household Net Worth as a Percent of GDP.  The underlying data is from the Federal Reserve’s Z.1 report, “Financial Accounts of the United States“:
(click on chart to enlarge image)
Household Net Worth As A Percent Of GDP
As seen in the above-referenced CalculatedRisk blog post:
Household net worth was at $84.9 trillion in Q1 2015, up from $83.3 billion in Q4.
The Fed estimated that the value of household real estate increased to $21.1 trillion in Q1 2015. The value of household real estate is still $1.4 trillion below the peak in early 2006 (not adjusted for inflation).
I have written in previous posts on this Household Net Worth (as a percent of GDP) topic:
As one can see, the first outsized peak was in 2000, and attained after the stock market bull market / stock market bubbles and economic strength.  The second outsized peak was in 2007, right near the peak of the housing bubble as well as near the stock market peak.
also:
I could extensively write about various interpretations that can be made from this chart.  One way this chart can be interpreted is a gauge of “what’s in it for me?” as far as the aggregated wealth citizens are gleaning from economic activity, as measured compared to GDP.
_____
The Special Note summarizes my overall thoughts about our economic situation
SPX at 2111.95 as this post is written

S&P500 Price Projections – Livingston Survey June 2015

The June 2015 Livingston Survey (pdf) published on June 10, 2015 contains, among its various forecasts, a S&P500 forecast.  It shows the following price forecast for the dates shown:
June 30, 2015   2107.70
Dec. 31, 2015   2158.00
June 30, 2016   2218.00
Dec. 31, 2016   2243.00
These figures represent the median value across the 28 forecasters on the survey’s panel.
_____
I post various economic forecasts because I believe they should be carefully monitored.  However, as those familiar with this blog are aware, I do not agree with many of the consensus estimates and much of the commentary in these forecast surveys.
_____
The Special Note summarizes my overall thoughts about our economic situation
SPX at 2109.45 as this post is written

Wednesday, June 10, 2015

Chicago Fed National Financial Conditions Index (NFCI)

The St. Louis Fed’s Financial Stress Index (STLFSI) is one index that is supposed to measure stress in the financial system.  Its reading as of the June 4, 2015 update (reflecting data through May 29) is -1.091.
Of course, there are a variety of other measures and indices that are supposed to measure financial stress and other related issues, both from the Federal Reserve as well as from private sources.
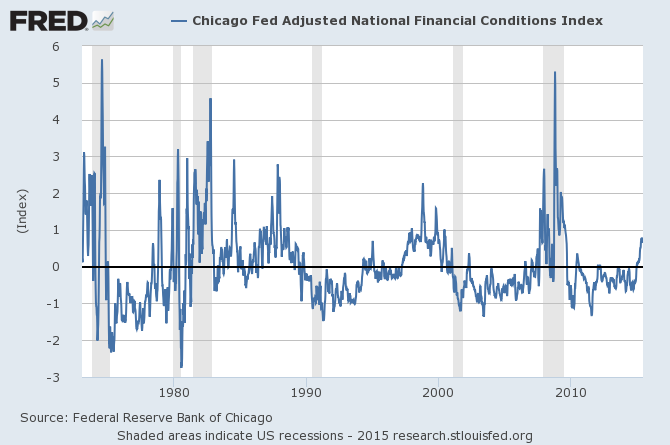
Two other indices that I regularly monitor include the Chicago Fed National Financial Conditions Index (NFCI) as well as the Chicago Fed Adjusted National Financial Conditions Index (ANFCI).
Here are summary descriptions of each, as seen in FRED:
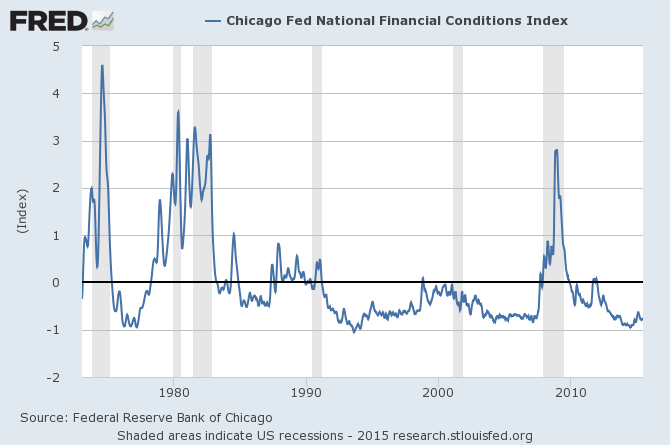
The National Financial Conditions Index (NFCI) measures risk, liquidity and leverage in money markets and debt and equity markets as well as in the traditional and “shadow” banking systems. Positive values of the NFCI indicate financial conditions that are tighter than average, while negative values indicate financial conditions that are looser than average.
The adjusted NFCI (ANFCI). This index isolates a component of financial conditions uncorrelated with economic conditions to provide an update on how financial conditions compare with current economic conditions.
For further information, please visit the Federal Reserve Bank of Chicago’s web site:
Below are the most recently updated charts of the NFCI and ANFCI, respectively.
The NFCI chart below was last updated on June 10, 2015 incorporating data from January 5,1973 to June 5, 2015, on a weekly basis.  The June 5, 2015 value is -.77:
(click on chart to enlarge image)
NFCI 6-10-15
Data Source: FRED, Federal Reserve Economic Data, Federal Reserve Bank of St. Louis; accessed June 10, 2015:
The ANFCI chart below was last updated on June 10, 2015 incorporating data from January 5,1973 to June 5, 2015, on a weekly basis.  The June 5 value is .67:
ANFCI_6-10-15
Data Source: FRED, Federal Reserve Economic Data, Federal Reserve Bank of St. Louis; accessed June 10, 2015:
_________
I post various indicators and indices because I believe they should be carefully monitored.  However, as those familiar with this blog are aware, I do not necessarily agree with what they depict or imply.
_____
The Special Note summarizes my overall thoughts about our economic situation
SPX at 2107.93 as this post is written

Building Financial Danger – June 10, 2015 Update

On October 17, 2011 I wrote a post titled “Danger Signs In The Stock Market, Financial System And Economy.”  This post is a brief 49th update to that post.
My overall analysis indicates a continuing elevated and growing level of financial danger which contains many worldwide and U.S.-specific “stresses” of a very complex nature. I have written numerous posts in this blog of some of what I consider both ongoing and recent “negative developments.”  These developments, as well as other exceedingly problematic conditions, have presented a highly perilous economic environment that endangers the overall financial system.
Also of ongoing immense importance is the existence of various immensely large asset bubbles, a subject of which I have extensively written.  While all of these asset bubbles are wildly pernicious and will have profound adverse future implications, hazards presented by the bond market bubble are especially notable.
Predicting the specific timing and extent of a stock market crash is always difficult, and the immense complexity of today’s economic situation makes such a prediction even more challenging. With that being said, my analyses indicate that the danger inherent in the financial system has surpassed the level at which a near-term outsized (from an ultra-long term perspective) stock market crash – that would also involve (as seen in 2008) various other markets as well – is of tremendous concern.
(note: the “next crash” has great significance and implications, as discussed in the post of January 6, 2012 titled “The Next Crash And Its Significance“ and various subsequent posts in the “Economic Depression” category)
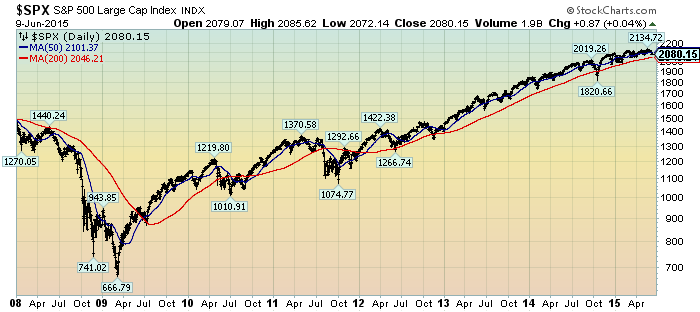
As reference, below is a daily chart since 2008 of the S&P500 (through June 9 with a last price of 2080.15), depicted on a LOG scale, indicating both the 50dma and 200dma as well as price labels:
(click on chart to enlarge image)(chart courtesy of StockCharts.com; chart creation and annotation by the author)
S&P500
_____
The Special Note summarizes my overall thoughts about our economic situation
SPX at 2104.81 as this post is written

Tuesday, June 9, 2015

NFIB Small Business Optimism – May 2015

The May NFIB Small Business Optimism report was released today, June 9, 2015. The headline of the Small Business Economic Trends report is “Small Business Optimism Rises In May, Yet Nothing To Write Home About.”
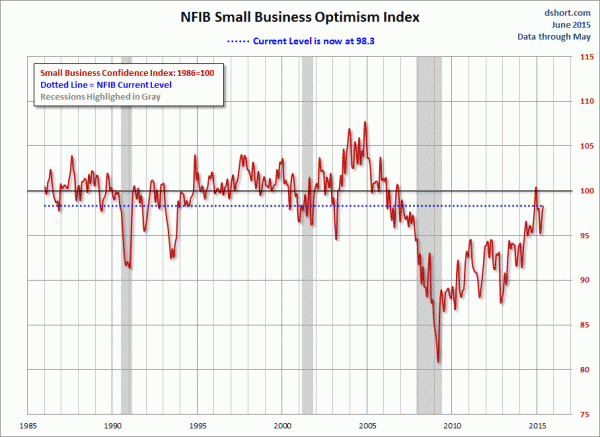
The Index of Small Business Optimism increased 1.4 points in May to 98.3.
Here are some excerpts from that I find particularly notable (but don’t necessarily agree with):
The Index of Small Business Optimism increased 1.4 points to 98.3 in spite of 5 months of lousy growth. May is the best reading since the 100.4 December reading but nothing to write home about. The 42 year average is 98.0, a bit lower than the 99.5 average through 2007. Eight of the 10 Index components posted improvements. Overall, the Index remained in a holding pattern, a few points below the pre-recession average, although at the 42 year average, and showing no tendency to “break out” into a stronger pattern of economic growth.
also:

LABOR MARKETS

Small businesses posted another decent month of job creation in May, a string of 5 solid months of job creation. On balance, owners added a net 0.13 workers per firm over the past few months. Fourteen percent reported raising employment an average of 2.7 workers per firm while 12 percent reported reducing employment an average of 3 workers per firm. Fifty-five percent reported hiring or trying to hire (up 2 points), but 47 percent, reported few or no qualified applicants for the positions they were trying to fill. Thirteen percent reported using temporary workers. Twenty-nine percent of all owners reported job openings they could not fill in the current period, up 2 points, revisiting the February reading, and the highest reading since April 2006.
also:

INVENTORIES AND SALES

The seasonally adjusted net percent of all owners reporting higher nominal sales in the past 3 months compared to the prior 3 months rose a stunning 11 points to a net 7 percent. Eleven percent cited weak sales as their top business problem (unchanged). Expected real sales volumes posted a 3 point decline, falling to a net 7 percent of owners expecting gains, after a 5 point decline in January and February, a 2 point decline in March and a 3 point decline in April. Overall, expectations are not showing a lot of strength.
The net percent of owners reporting inventory increases fell 4 points to a net negative 5 percent (seasonally adjusted). The net percent of owners viewing current inventory stocks as “too low” improved 1 point to a net 0 percent. The reductions were apparently a result of unexpectedly strong improvement in sales trends, and left balance in the assessment of current stocks. The net percent of owners planning to add to inventory was unchanged at a net 4 percent, in sympathy with the more widespread reduction in stocks. Inventory investment might have been even stronger in light of the liquidation had expectations for real sales gains improved rather than softened.
Here is a chart of the NFIB Small Business Optimism chart, as seen in the June 9 Doug Short post titled “Small Business Optimism Rises:  Best Reading Since December“:
NFIB Small Business Optimism
Further details regarding small business conditions can be seen in the full May 2015 NFIB Small Business Economic Trends (pdf) report.
_____
The Special Note summarizes my overall thoughts about our economic situation
SPX at 2082.66 as this post is written

Monday, June 8, 2015

“Not In Labor Force” Statistic – As Of June 2015

In the November 13, 2013 post (“Not In Labor Force Statistic“) I featured editorial commentary from the Wall Street Journal, as well as an accompanying long-term chart, with regard to the number of people not working.
Also, on February 9, 2015 I wrote another post titled “Unemployment And The ‘Not In Labor Force’ Statistic,” in which I discussed various facets of this measure.
Below is an updated chart regarding this statistic.  The current figure, last updated on June 5, 2015 depicting data through May 2015, is 92.736 million people (Not Seasonally Adjusted):
LNU05000000
Data Source: FRED, Federal Reserve Economic Data, Federal Reserve Bank of St. Louis: Not In Labor Force [LNU05000000] ; U.S. Department of Labor: Bureau of Labor Statistics; accessed June 8, 2015;
_____
The Special Note summarizes my overall thoughts about our economic situation
SPX at 2079.28 as this post is written