Thursday, February 28, 2013

Durable Goods New Orders – Long-Term Charts Through January 2013


Many people place emphasis on Durable Goods New Orders as a prominent economic indicator and/or leading economic indicator.

For reference, below are charts depicting this measure.

First, from the St. Louis Fed site (FRED), a chart through January, last updated on February 27.  This value is 216,981 ($ Millions) :

(click on charts to enlarge images)

DGORDER_2-27-13 216981

-

Here is the chart depicting this measure on a “Percentage Change from a Year Ago” basis:

DGORDER 2-27-13 Percent Change from Year Ago

_________

I post various indicators and indices because I believe they should be carefully monitored.  However, as those familiar with this blog are aware, I do not necessarily agree with what they depict or imply.
_____

The Special Note summarizes my overall thoughts about our economic situation

SPX at 1515.99 as this post is written

Wednesday, February 27, 2013

Trends Of S&P500 Earnings Forecasts


S&P500 earnings trends and estimates is a notably important topic, for a variety of reasons, at this point in time.

FactSet publishes a report titled "Earnings Insight" that contains a variety of information including the trends and expectations of S&P500 earnings.

For reference purposes, here are two charts as seen in the "Earnings Insight" report of February 22, 2013:

from page 16:

(click on charts to enlarge images)

FactSet Earnings Insight 2-22-12 Bottom-up-and-Top-Down-EPS-Estimates

from page 17:

FactSet Earnings Insight 2-22-13 - EPS-Actuals-and-Estimates-2010-to-2013-Quarterly
_____

I post various economic forecasts because I believe they should be carefully monitored.  However, as those familiar with this blog are aware, I do not agree with many of the consensus estimates and much of the commentary in these forecast surveys.
_____

The Special Note summarizes my overall thoughts about our economic situation

SPX at 1515.72 as this post is written

House Prices Reference Chart


As a reference for long-term house price index trends, below is a chart, updated with the most current data (through December), from the CalculatedRisk blog post of February 26 titled “Real House Prices and Price-to-Rent Ratio” :

(click on chart to enlarge image)

CR 2-26-13 NominalPricesDec2012

_____

The Special Note summarizes my overall thoughts about our economic situation

SPX at 1496.94 as this post is written

Tuesday, February 26, 2013

Updates Of Economic Indicators February 2013


Here is an update on various indicators that are supposed to predict and/or depict economic activity.  These indicators have been discussed in previous blog posts:

The February Chicago Fed National Activity Index (CFNAI)(pdf) updated as of February 25, 2013:

cfnai_monthly_MA3 2-25-13

-


As of 2/22/13 (incorporating data through 2/15/13) the WLI was at 129.1 and the WLI, Gr. was at 7.6%.
A chart of the WLI, Gr. since 2000, from Doug Short’s blog of February 22 titled “ECRI 'Recession' Update:  Proprietary Indicators Slip Again” :

Dshort 2-22-13 ECRI-WLI-growth-since-2000 7.6

-


Here is the latest chart, depicting 2-16-11 to 2-16-13:

ads_2-16-11 - 2-16-13

-


As per the February 21 press release, the LEI was at 94.1 and the CEI was at 106.5 in January.

An excerpt from the February release:
Says Ken Goldstein, economist at The Conference Board: “The indicators point to an underlying economy that remains relatively sound but sluggish. Credit use has picked up, driven in part by relatively strong demand for auto loans. The biggest positive factor is housing. The housing market is now at twice the level reached during its recessionary lows, and will likely continue to improve through the spring, delivering some growth momentum to the labor market and the overall economy. The biggest risk, however, is the adverse impact of cuts in federal spending.”
Here is a chart of the LEI from Doug Short’s blog post of February 21 titled “Conference Board Leading Economic Index:  'Slow But Continued Expansion'" :

Dshort 2-21-13 CB-LEI

_________

I post various indicators and indices because I believe they should be carefully monitored.  However, as those familiar with this blog are aware, I do not necessarily agree with what they depict or imply.
_____

The Special Note summarizes my overall thoughts about our economic situation

SPX at 1487.85 as this post is written

Monday, February 25, 2013

S&P500 Earnings Estimates For 2013 & 2014


As many are aware, Thomson Reuters publishes earnings estimates for the S&P500.  (My other posts concerning S&P earnings estimates can be found under the S&P500 Earnings label)

The following estimates are from Exhibit 12 of "The Director's Report" of February 22, 2013, and represent an aggregation of individual S&P500 component "bottom up" analyst forecasts:

Year 2013 estimate:
$111.86/share

Year 2014 estimate:
$124.84/share
_____

I post various economic forecasts because I believe they should be carefully monitored.  However, as those familiar with this blog are aware, I do not agree with many of the consensus estimates and much of the commentary in these forecast surveys.
_____

The Special Note summarizes my overall thoughts about our economic situation

SPX at 1515.60 as this post is writte

Friday, February 22, 2013

Long-Term Charts Of The ECRI WLI & ECRI WLI, Gr. – February 22, 2013 Update


As I stated in my July 12, 2010 post ("ECRI WLI Growth History"):
For a variety of reasons, I am not as enamored with ECRI’s WLI and WLI Growth measures as many are.
However, I do think the measures are important and deserve close monitoring and scrutiny.
The movement of the ECRI WLI and WLI, Gr. is particularly notable at this time, as ECRI publicly announced on September 30, 2011 that the U.S. was “tipping into recession,” and ECRI has reiterated the view that the U.S. economy is currently in a recession, seen most recently in these two media sources of December 7, 2012:
“Reviewing the indicators used to officially decide U.S. recession dates, it looks like the recession began around July 2012.”
Other past notable 2012 reaffirmations of the September 30, 2011 recession call by ECRI were seen (in chronological order)  on March 15 (“Why Our Recession Call Stands”) as well as various interviews and statements the week of May 6, including:
Also, subsequent to May 2012:
-

Below are three long-term charts, from Doug Short’s blog post of February 22 titled “ECRI ‘Recession’ Update:  Proprietary Indicators Slip Again.”  These charts are on a weekly basis through the February 22 release, indicating data through February 15, 2013.

Here is the ECRI WLI (defined at ECRI’s glossary):

(click on charts to enlarge images)

Dshort 2-22-13 ECRI-WLI 129.1

-

This next chart depicts, on a long-term basis, the Year-over-Year change in the 4-week moving average of the WLI:

Dshort 2-22-13 ECRI-WLI-YoY 5.3 percent

-

This last chart depicts, on a long-term basis, the WLI, Gr.:

Dshort 2-22-13 ECRI-WLI-growth-since-1965 7.6

_________

I post various economic indicators and indices because I believe they should be carefully monitored.  However, as those familiar with this blog are aware, I do not necessarily agree with what they depict or imply.
_____

The Special Note summarizes my overall thoughts about our economic situation

SPX at 1511.82 as this post is written

St. Louis Financial Stress Index – February 21, 2013 Update


On March 28, 2011 I wrote a post ("The STLFSI") about the  St. Louis Fed’s Financial Stress Index (STLFSI) which is supposed to measure stress in the financial system.  For reference purposes, the most recent chart is seen below.  This chart was last updated on February 21, incorporating data from December 31,1993 to February 15, 2013 on a weekly basis.  The February 15, 2013 value is -.586 :

(click on chart to enlarge image)

STLFSI_2-21-13 -.586

-

Here is the STLFSI chart from a 1-year perspective:

STLFSI_2-21-13 1-year

_________

I post various indicators and indices because I believe they should be carefully monitored.  However, as those familiar with this blog are aware, I do not necessarily agree with what they depict or imply.
_____

The Special Note summarizes my overall thoughts about our economic situation

SPX at 1502.42 as this post is written

Thursday, February 21, 2013

Walmart’s Q4 2013 Results – Comments


I found various notable items in Walmart’s Q4 2013 earnings call transcript (pdf) dated January 21, 2013.  I view Walmart’s results and comments as particularly noteworthy given their retail prominence and focus on low prices.  I have previously commented on their quarterly conference call comments; these previous posts are found under the “paycheck to paycheck” label.

Here are various excerpts that I find most notable:

comments from Mike Duke, president and CEO of Wal-Mart Stores, Inc, page 8:

Walmart leveraged operating expenses again this year. That’s three consecutive years now that we reduced operating expenses as a percentage of sales.

comments from Mike Duke, page 9:

The focus of Bill and his team on cost containment has never been stronger, as Walmart U.S. leveraged operating expenses by 27 basis points this year. We pass the majority of these cost savings to customers every day. Our EDLP promise – along with the broad assortment – is the key to driving sales. Strong merchandising, efficient operations and thoughtful use of capital will keep Walmart U.S. strong into the future.

comments from Mike Duke, page 10:

Fifth, e-commerce. I’m excited about our investments in e-commerce to help us grow with our customers and expand the Walmart shopping experience.

comments from Bill Simon, president and CEO of Walmart U.S., page 16:

Our customers continue to rely on us to deliver Every Day Low Prices. This is evident by our consistent gains in market share across the majority of the businesses.

comments from Bill Simon, page 17:

You heard us talk about the early response to layaway during the third quarter, and I’m pleased to say the momentum continued, with net layaway sales up almost 10 percent for the season versus last year.

comments from Bill Simon, page 21:

You’ve heard us say, supercenters remain our primary growth vehicle, and we will continue to expand this format to drive share.

also:

We also accelerated the small format rollout. In fiscal 2013, we  opened 76 small formats, including Neighborhood Markets and Express stores, allowing us to serve even more customers across the country. In fiscal 2014, we plan to add approximately 100 small stores.

comments from Bill Simon, page 22:

However, February sales started slower than planned due in large part, to the delay in income tax refunds. We began seeing increased tax refund check activity late last week in our stores. This resulted in a more normalized sales pattern for this time of the year.

also:

Due to the slower sales rate in the first few weeks of this year’s first quarter, we’re forecasting comp sales for the 13-week period from January 26 to April 26, 2013 to be around flat.
_____

The Special Note summarizes my overall thoughts about our economic situation

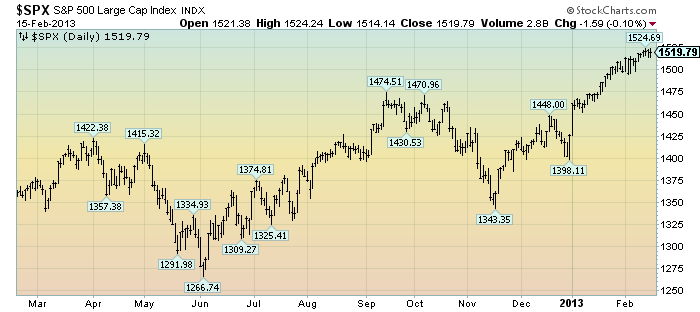
SPX at 1505.31 as this post is written

Wednesday, February 20, 2013

Current Economic Situation


With regard to our current economic situation,  my thoughts can best be described/summarized by the posts found under the 21 “Building Financial Danger” posts.

My thoughts concerning our ongoing economic situation – with future implications – can be seen on the page titled “A Special Note On Our Economic Situation,” which has been found near the bottom of every blog post since August 15, 2010.
_____

The Special Note summarizes my overall thoughts about our economic situation

SPX at 1529.12 as this post is written

Tuesday, February 19, 2013

Excessive Positive Sentiment And Froth In The Stock Market


In this post I would like to highlight various areas which I believe indicate excessively positive sentiment and related measures indicating "froth" in the stock market.

The stock market has had a remarkable "run" since roughly mid-November.  This is illustrated in a 1-year daily chart of the stock market (S&P500) :

(click on chart to enlarge image)(chart courtesy of StockCharts.com; chart creation and annotation by the author)

EconomicGreenfield 2-19-13 SPX 1-year

-

From a general standpoint, there doesn't appear to be much - if any - of a "wall of worry."  Any type of significant apprehension on the part of stock market investors appears lacking.  Additionally, there seems to be an attitude that additional QE measures preclude any substantial, lasting economic and/or financial market adversity.

From a specific standpoint, there is an extensive list of  indicators showing a high level of “frothiness” and other excesses in the stock market.  Many of these indicators are at either all-time record levels, or are at levels which occur only a few times over a decade (or decades.)

While the full list of these indicators is exceedingly lengthy, a sampling of such indicators includes the following:
  • Strong "price action" as seen in the price chart of the S&P500 – as well as many individual stocks.  Many stocks and indices show an increasingly “parabolic” trajectory.
  • Recent record-high stock market fund inflows.
  • Buoyant stock-market breadth; an excerpt from the February 13th SentimenTrader.com commentary:  "For 8 consecutive days in late January, more than 90% of stocks had closed above their 50-days.  Going back to 1996, the only time we saw a longer streak was June 10, 2003 as stocks emerged from the bear market."
  • Broad-based bullishness among newsletter writers.  An excerpt from the February 11 SentimenTrader.com newsletter:  "According to Hulbert Financial Digest, newsletters have increased their recommended Nasdaq exposure to nearly 94%, meaning that the average newsletter is recommending a nearly fully invested position.  Since the year 2000, there has been only 1 week that exceeded this reading, which was March 31, 2000."
  • A highly subdued VIX, sustaining a level below 20.  I have written of the VIX level of 20 and its significance on a few occasions, including the February 7, 2012 post ("The VIX Level Of 20 And Its Continual Significance.")  As seen on the chart below, from a 10-year daily perspective the VIX (shown on a "LOG" basis in red, with the S&P500 shown below it) has been sustaining a remarkably low level, now at 12.84.  When one looks at the chart, one can seen that current levels are (at least) somewhat reminiscent of the "golden era" of roughly 2004-2007:
(click on chart to enlarge image)(chart courtesy of StockCharts.com; chart creation and annotation by the author)

EconomicGreenfield 2-19-13 VIX 10-year

-

While excessive sentiment and signs of stock market "froth" are not necessarily "proof" of a coming near-term correction or impending calamity, history indicates that such market excess in itself constitutes a dangerous condition.  This is especially notable when combined with an array of other economic and financial perils, as featured throughout this blog.

Cumulatively, my overall analysis continues to indicate a building level of financial danger, highly outsized by historical standards.
_____

The Special Note summarizes my overall thoughts about our economic situation

SPX at 1526.31 as this post is written

Sunday, February 17, 2013

Consumer Confidence Surveys – As Of February 15, 2013


Doug Short had a blog post of February 15 ("Michigan Consumer Sentiment Again Beats Expectations") in which he presents the latest Conference Board Consumer Confidence and Thomson/Reuters University of Michigan Consumer Sentiment Index charts.  They are presented below:

(click on charts to enlarge images)

Dshort 2-15-13 - Conference-Board-consumer-confidence-index

-

Dshort 2-15-13 Michigan-consumer-sentiment-index

-

There are a few aspects of the above charts that I find highly noteworthy.  Of course, the continuing subdued absolute levels of these two surveys is disconcerting.

Also, I find the “behavior” of these readings to be quite disparate as compared to the other post-recession periods, as shown in the charts between the gray shaded areas (the gray areas denote recessions as defined by the NBER.)

While I don’t believe that confidence surveys should be overemphasized, I find these readings to be very problematical, especially in light of a variety of other highly disconcerting measures highlighted throughout this blog.

_____

The Special Note summarizes my overall thoughts about our economic situation

SPX at 1519.79 as this post is written

Friday, February 15, 2013

Long-Term Charts Of The ECRI WLI & ECRI WLI, Gr. – February 15, 2013 Update


As I stated in my July 12, 2010 post ("ECRI WLI Growth History"):
For a variety of reasons, I am not as enamored with ECRI’s WLI and WLI Growth measures as many are.
However, I do think the measures are important and deserve close monitoring and scrutiny.
The movement of the ECRI WLI and WLI, Gr. is particularly notable at this time, as ECRI publicly announced on September 30, 2011 that the U.S. was “tipping into recession,” and ECRI has reiterated the view that the U.S. economy is currently in a recession, seen most recently in these two media sources of December 7, 2012:
“Reviewing the indicators used to officially decide U.S. recession dates, it looks like the recession began around July 2012.”
Other past notable 2012 reaffirmations of the September 30, 2011 recession call by ECRI were seen (in chronological order)  on March 15 (“Why Our Recession Call Stands”) as well as various interviews and statements the week of May 6, including:
Also, subsequent to May 2012:
-

Below are three long-term charts, from Doug Short’s blog post of February 15 titled “ECRI ‘Recession’ Update:  Proprietary Indicators Take a Pause.”  These charts are on a weekly basis through the February 15 release, indicating data through February 8, 2013.

Here is the ECRI WLI (defined at ECRI’s glossary):

(click on charts to enlarge images)

Dshort 2-15-13 ECRI-WLI 129.6

-

This next chart depicts, on a long-term basis, the Year-over-Year change in the 4-week moving average of the WLI:

Dshort 2-15-13 ECRI-WLI-YoY 5.6 percent

-

This last chart depicts, on a long-term basis, the WLI, Gr.:

Dshort 2-15-13 ECRI-WLI-growth-since-1965 8.3

_________

I post various economic indicators and indices because I believe they should be carefully monitored.  However, as those familiar with this blog are aware, I do not necessarily agree with what they depict or imply.
_____

The Special Note summarizes my overall thoughts about our economic situation

SPX at 1518.61 as this post is written

St. Louis Financial Stress Index – February 14, 2013 Update


On March 28, 2011 I wrote a post (“The STLFSI“) about the  St. Louis Fed’s Financial Stress Index (STLFSI) which is supposed to measure stress in the financial system.  For reference purposes, the most recent chart is seen below.  This chart was last updated on February 14, incorporating data from December 31,1993 to February 8, 2013 on a weekly basis.  The February 8, 2013 value is -.52 :

(click on chart to enlarge image)

STLFSI_2-14-13 -.52

-

Here is the STLFSI chart from a 1-year perspective:

STLFSI_2-14-13 1-year

_________

I post various indicators and indices because I believe they should be carefully monitored.  However, as those familiar with this blog are aware, I do not necessarily agree with what they depict or imply.
_____

The Special Note summarizes my overall thoughts about our economic situation

SPX at 1521.99 as this post is written