Showing posts with label Gold. Show all posts

Tuesday, February 16, 2016

Gold, Silver And The Gold:Silver Ratio

As a reference, below is a monthly chart of Gold, Silver, the Gold:Silver ratio, and the S&P500, from January 1, 1980 through February 12, 2016 with price labels:
(click on chart to enlarge image)(chart courtesy of StockCharts.com; chart creation and annotation by the author)
Gold-Silver Monthly Since 1980
_____
The Special Note summarizes my overall thoughts about our economic situation
SPX at 1883.59 as this post is written

Monday, June 17, 2013

Thoughts On The Price Of Gold

The price of Gold is particularly important at this juncture, for a number of reasons.

I have recently written of the decline in Gold's price and its significance with regard to "deflationary pressures," most recently in the June 10 post titled "The Prospect Of Deflation" as well as the May 20 post (seen on Doug Short's blog) titled "The Recent Decline In Gold."

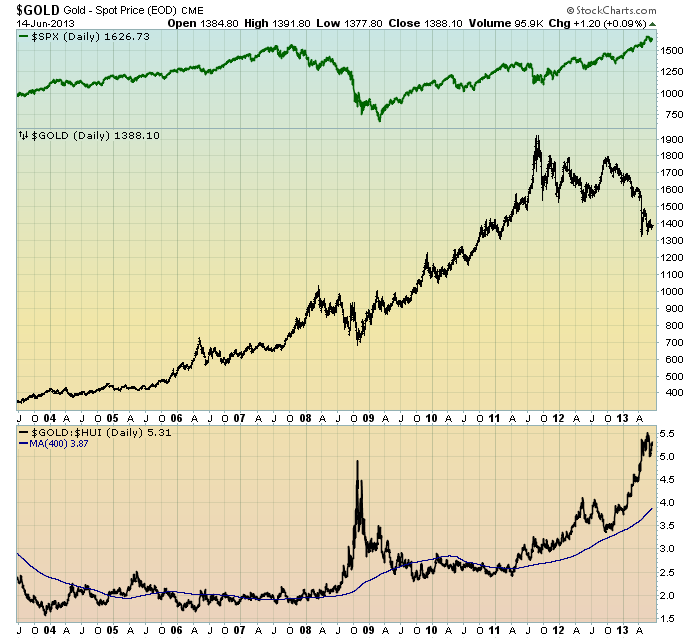
A daily price chart of Gold for the last 10 years (through June 14) is seen below.  Gold's price is depicted in the middle plot of the chart, with the S&P500's price seen above it (in green) and the Gold:HUI ratio on the bottom plot:

(click on chart to enlarge image)(chart courtesy of StockCharts.com; chart creation and annotation by the author)

EconomicGreenfield 6-17-13 Gold

I believe that a few items are especially notable with regard to the above chart.  As one can see, the recent Gold "price action" appears to be in a downward consolidation, and appears particularly poor in light of the strong upward price movements of the S&P500.  From a variety of "technical analysis" perspectives, it appears that Gold's price is vulnerable to further decline, likely substantial.

Further supporting the idea that Gold is vulnerable to a significant decline is the price of the HUI Index, if one assumes that Gold stocks augur the future price of Gold.  As one can see in the bottom Gold:HUI plot, the 400-day moving average (the thin blue line) of the Gold:HUI ratio has been increasing since roughly mid-2011.  I think that it is important to note that during Gold's advance from 2005 through mid-2011, this 400-day moving average (dma) largely stayed in a range of roughly 2-2.5.  Now, as one can see, the ratio is at 3.87.  If Gold were to decline back to the 2.5 level of the Gold:HUI 400dma, Gold would be at $651/oz, based upon a current HUI price of 260.55.  (The 2.0 level of the 400dma would equate to a Gold price of $521.)  While these Gold prices of $651 and $521 are simply rough projections, they do speak to not only a potential downside in Gold's price, but also to the potential magnitude of the "deflationary pressures" that may (likely) accompany such a strongly declining Gold price.

It should also be noted that various other commodities also exhibit poor "price action" and seeming further downside price vulnerability.

While I believe that Gold is influenced by many complex factors, as I wrote of in my April 27, 2011 post ("Reason's Behind Gold's Ascent"), I continue to believe that Gold's greatest upside factor is that of a "safe haven."

_____

The Special Note summarizes my overall thoughts about our economic situation

SPX at 1640.01 as this post is written

Monday, April 15, 2013

Gold's Decline And Implications


This post is an update to that of April 5, 2012, titled "The Current Gold Price And Its Broader Implications."

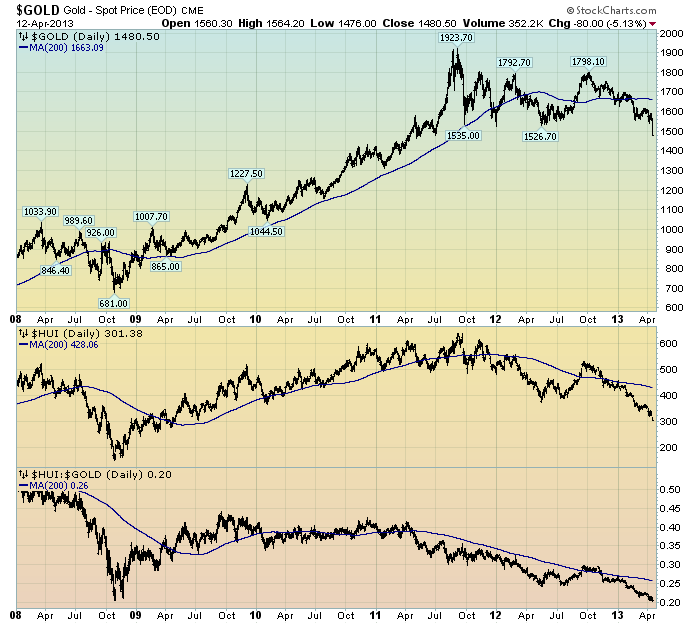
Below is a chart similar to that displayed in the April 5 post:

(click on chart to enlarge image)(chart courtesy of StockCharts.com; chart creation and annotation by the author)

EconomicGreenfield 4-15-13 Gold HUI HUI-Gold

-

The above chart is depicted on a daily basis from 2008 through April 12, with the thin blue line depicting the 200dma of the Gold price, HUI and HUI:Gold ratio.  The closing price of Gold on April 12 is $1480.50/oz.  I find several items to be noteworthy.  First is the decline in the price of Gold, which can be seen  in the upper plot of the chart.  As one can see, the Gold price has been (relatively) rangebound since its highs in the summer of 2011, but has recently been dropping below that range.   Also, the HUI Index has been (generally) dropping since those Gold highs in the summer of 2011.  Lastly, one can see that the HUI:Gold ratio has been (generally) sinking during the post-summer 2011 Gold highs as well, and is now roughly at the same lows as those experienced during the Financial Crisis.

In aggregate, I believe the movements in Gold and Gold stocks (using the HUI as a proxy) is disconcerting for various reasons, such as that I explained in the aforementioned April 5 post, which references the post of August 25, 2011, "Gold And Deflationary Pressures."

_____

The Special Note summarizes my overall thoughts about our economic situation

SPX at 1579.04 as this post is written

Thursday, April 5, 2012

The Current Gold Price And Its Broader Implications


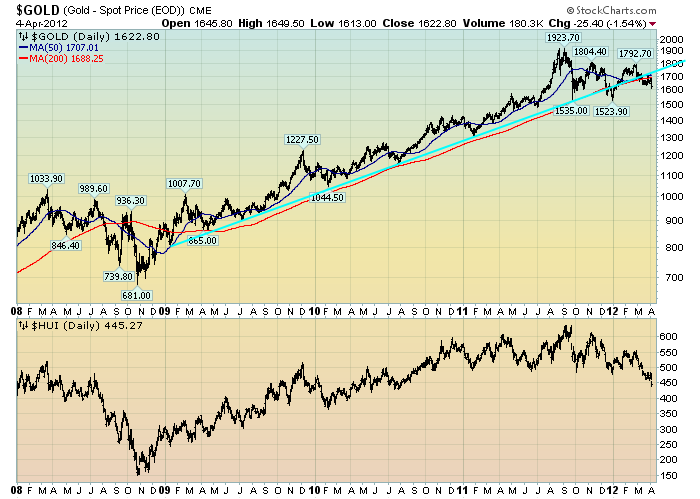
Gold has been in a correction (or consolidation) after a very steep rally.

It appears as if Gold is at a critical juncture at present.  The chart below depicts Gold on a daily basis, LOG scale, since 2008, as well as the HUI (Gold Bugs) stock index.   Gold, at $1622.80/oz, is currently below both the 200dma (depicted in red) as well as the 50dma (depicted in blue).  A rising trendline (broken to the downside) since early 2009 is shown in cyan:

(click on chart to enlarge image)(chart courtesy of StockCharts.com; chart creation and annotation by the author)


-

I have written of the broader implications of Gold’s price movements.  In one post, that of August 25, 2011 ("Gold And Deflationary Pressures") I wrote the following, which I continue to believe is applicable:
I am very closely monitoring Gold as I believe a steep, abnormal correction could serve to (further) indicate deflationary pressures – which of course would have outsized impacts on financial markets, the economy, and economic policy (particularly QE3 or some other large intervention.)
_____

The Special Note summarizes my overall thoughts about our economic situation

SPX at 1398.97 as this post is written

Wednesday, December 28, 2011

The Current Gold Price And Its Broader Significance


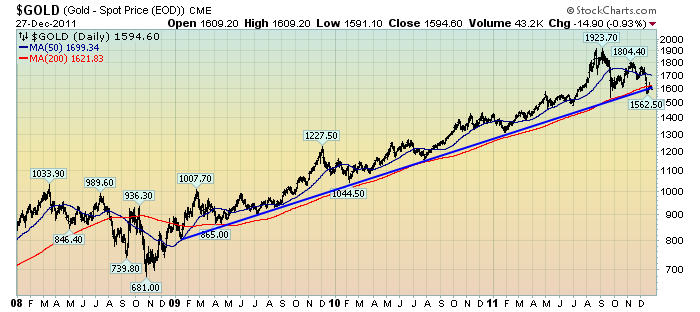
Gold has recently been in a correction (or consolidation) after a very steep rally.

It appears as if Gold is at a critical juncture at present.  As seen in the chart below (which depicts Gold on a daily basis, LOG scale, since 2008) Gold, at $1594.60/oz, is currently right below both the 200dma (depicted in red) as well as the rising trendline (recently broken to the downside) since early 2009:

(click on chart to enlarge image)(chart courtesy of StockCharts.com; chart creation and annotation by the author)


From an overall Technical Analysis standpoint, on both daily and weekly viewpoints, Gold appears vulnerable to a (significant) decline.

I have recently written of the broader implications of Gold's price movements.  In one post, that of August 25 ("Gold And Deflationary Pressures") I wrote the following, which I feel is still currently applicable:
I am very closely monitoring Gold as I believe a steep, abnormal correction could serve to (further) indicate deflationary pressures – which of course would have outsized impacts on financial markets, the economy, and economic policy (particularly QE3 or some other large intervention.)
_____

The Special Note summarizes my overall thoughts about our economic situation

SPX at 1265.43 as this post is written

Wednesday, September 28, 2011

Gold's Uptrend Since 2009


In my August 25 post ("Gold And Deflationary Pressures") I spoke of the correction in Gold and its broader economic implications.  At that time Gold was at $1726/oz (December futures.)

Now, the December Gold futures are at $1645.1/oz.  If one views Gold's ascent from early 2009, one can see a rising trendline - one that seems very significant.  A daily chart of Gold since 2008 is shown below, with the rising trendline (which has served as support) in blue, as well as the 50 and 200dmas in dark blue and red, respectively:

(click on chart to enlarge image)(chart courtesy of StockCharts.com; annotations by the author)


I am continuing to monitor Gold's correction very closely, for many reasons including those indicated in the aforementioned August 25 post.
_____


The Special Note summarizes my overall thoughts about our economic situation


SPX at 1175.38 as this post is written

Thursday, August 25, 2011

Gold And Deflationary Pressures


In my April 27 post ("Reasons Behind Gold's Ascent") I outlined a variety of factors that I believed were driving Gold's advance.

Point #4 on the list was "...an expectation of high future inflation."

It should be also noted that the inverse of this condition - an expectation of deflation - can serve to depress Gold's price.

This is particularly noteworthy at present, as Gold has recently started a correction after a very steep rally.  I am very closely monitoring Gold as I believe a steep, abnormal correction could serve to (further) indicate deflationary pressures - which of course would have outsized impacts on financial markets, the economy, and economic policy (particularly QE3 or some other large intervention.)

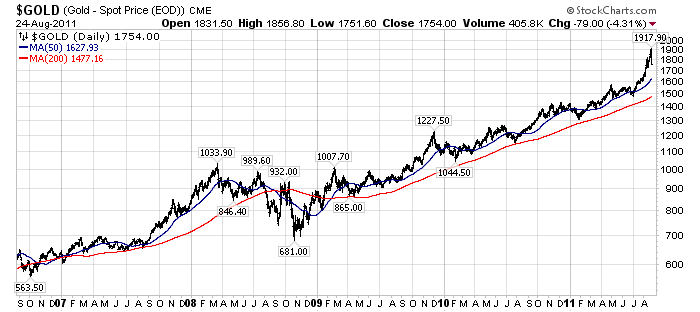
For reference, here is the daily Gold price chart for the last 5 years, updated through yesterday, shown on a LOG scale with both the 50dma  and 200dma lines as indicated:

(click on chart to enlarge image)(chart courtesy of StockCharts.com; annotations by the author)


Gold at $1726/oz (December futures) at the time of this post
_____

The Special Note summarizes my overall thoughts about our economic situation


SPX at 1176.07 as this post is written

Wednesday, April 27, 2011

Reasons Behind Gold's Ascent

The reasons behind Gold's (as well as Silver's) price movements is always complex. There are a lot of factors involved.

Back on September 22, 2010, I wrote a blog post (on another site) titled "What is Gold 'Telling Us'"? I have reprinted it below, as I think that it is important to recognize the potential factors involved. Of course, this does not speak as to whether the rapid ascent is sustainable, or ultimate price targets.

Here is the post:

As Gold continues its rapid ascent, I think it is important to consider what such price action may be "telling us."

Many classify Gold's strong price action as that of an asset experiencing a "bubble" - and as such do not properly heed the fundamentals that may be driving its price action. I have previously discussed whether Gold is in a bubble in this post.

While Gold may be advancing for many reasons, I would offer these (in no particular order) as among the top reasons for its ascent:
  1. Vulnerability of the US Dollar to a substantial decline, discussed in this article.
  2. Excessively low interest rates.
  3. Too much "money printing" - both now and projected in the future.
  4. Related to Points 1-3 above, an expectation of high future inflation.
  5. Large money flows into the Gold market, which is relatively (in proportion to other asset classes) small.
  6. A portent of an impending adverse economic event(s)
  7. Related to point 6 above, a desire to obtain a "safe haven"
I believe that the most important issue for those holding Gold is the following, as I mentioned in the "Is Gold Experiencing A Bubble?" post mentioned above:

"Perhaps the greater question should be whether various asset classes are currently experiencing bubbles, and whether Gold is just one of a few (or many) classes in such a condition. In effect, is Gold's price strongly (positively) correlated to that of other asset classes, and if so, why?"
_____

The Special Note summarizes my overall thoughts about our economic situation

SPX at 1347.99 as this post is written

Gold (June Gold futures) at $1512/oz as this post is written

Wednesday, April 6, 2011

Gold Vs. The U.S. Dollar

In yesterday's post I displayed various charts of the U.S. Dollar from a long-term perspective.

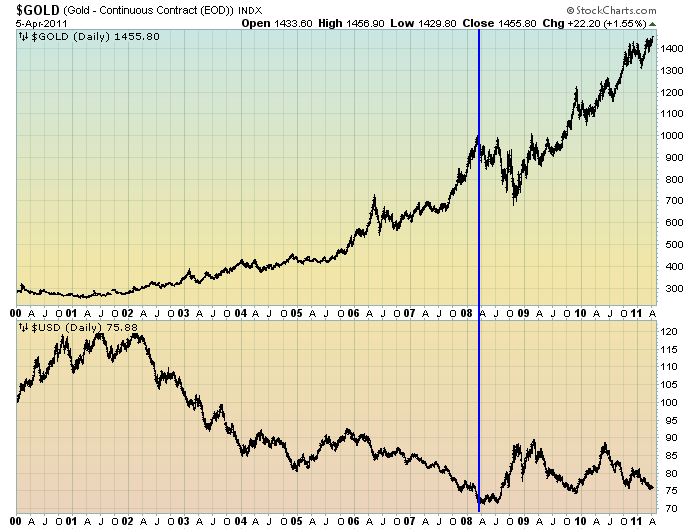
Below is a chart that I find interesting.  It shows, from the year 2000 to present, the prices of Gold and the U.S. Dollar on a daily basis, linear-scale:

(chart courtesy of StockCharts.com;  annotation by the author)

(click on chart image to enlarge)


-

As one can see, as annotated by the horizontal blue line, since the U.S. Dollar closed at a low of 71.45 on March 26, 2008, Gold has gone from roughly the $1000 area to yesterday's close of $1455.80/oz.  Meanwhile, the U.S. Dollar has yet to fall below that March 26, 2008 low.

This can be interpreted in a number of ways.   One interpretation that I favor is seen stated below, from a piece I wrote on February 3:
Further supporting the idea that the U.S. dollar is vulnerable is the very strong price action of gold, other commodities, other currencies, and the stock market. While it may be easy to believe gold and other commodities are in a bubble, such strong price action (which has far outpaced the U.S. dollar’s decline to date) may well be indicating a large impending dollar decline.
_____

The Special Note summarizes my overall thoughts about our economic situation

SPX at 1332.63 as this post is written

Monday, October 25, 2010

Market Overview - Part II: U.S. Dollar, Japanese Yen & Gold

(this is the second in a series of five posts concerning the markets)

I would like to start by featuring a couple of long-term charts of the U.S. Dollar.

U.S. Dollar weakness is a foremost concern of mine.  As such, I have extensively written about it.  I am very concerned that the actions being taken to "improve" our economic situation will dramatically weaken the Dollar.  Should the Dollar substantially decline from here, as I expect, the negative consequences will far outweigh any benefits.  The negative impact of a substantial Dollar decline can't be overstated, in my opinion.

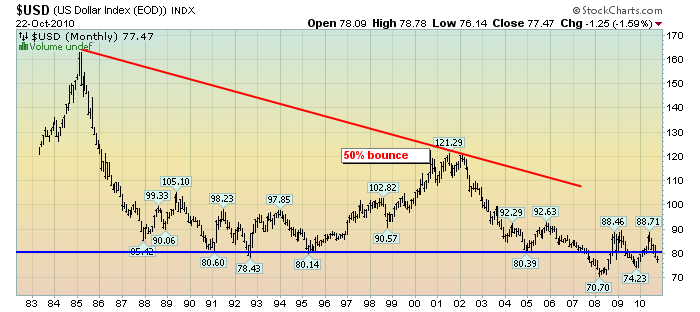
First, a look at the monthly U.S. Dollar from 1983.  This clearly shows a long-term weakness, with the blue line showing technical support (until 2007) that has now turned into (technical) resistance:

charts courtesy of StockCharts.com (click on images to enlarge charts):


Next, another chart, this one focused on the daily U.S. Dollar since 2000 on a LOG scale.  The red line represents both a trendline as well as a relatively good visual "best-fit" line.  The gray dotted line is the 200-day M.A. (moving average).  As seen on this chart, the U.S. Dollar looks vulnerable to continuing its downward trend that has been interrupted since early 2008:


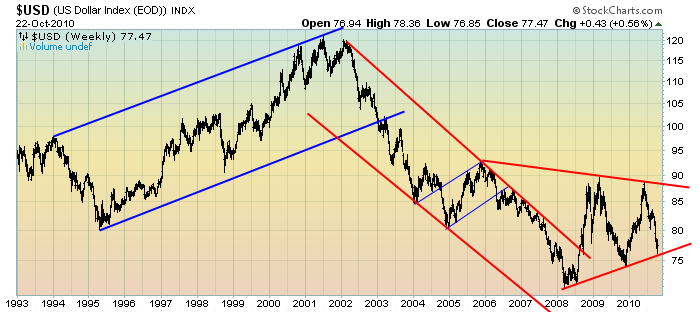
Lastly, a chart of the Dollar on a weekly LOG scale.  There are some clearly marked  channels here, with a large, prominent triangle featured.  Triangles are thought of as "continuation" patterns.  In this case, it would be a continuation of the Dollar downtrend since 2002:


-

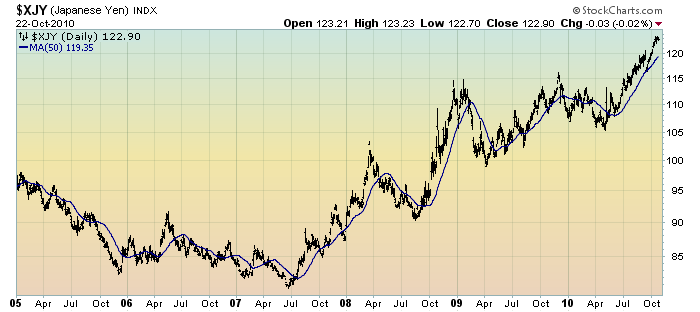
Next, onto the Japanese Yen.  Up until 2-3 years ago, it was widely believed and (commented upon) that a rising Yen was a sign of danger.   This belief seems to have diminished; however, the strength of the Yen has not.  Is the rising Yen still a signal of danger in the markets?  I believe that it is.

Here is the daily chart since 2005 as depicted on a LOG scale.  The 50-day M.A. is shown in blue.  As one can see, there has been a continued string of strong uptrends, and the Yen pricing action is increasingly "parabolic" in nature:


-

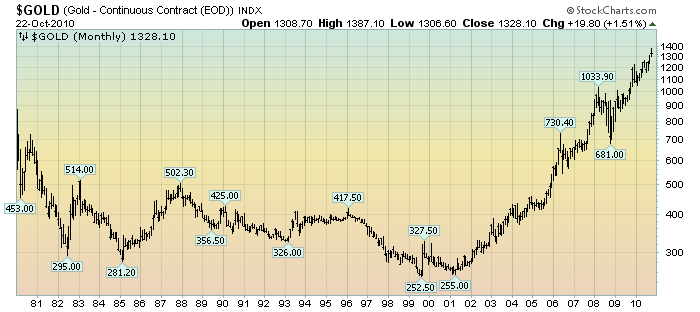
Lastly, a Gold chart.  I have written many posts about Gold.  Of course, the most common question that arises with regard to Gold is whether it is in a bubble, which I have discussed previously.  Certainly, the price action since 2001 would support such a claim.  However, there is much more that should be considered before one can conclude that Gold is in a bubble.

Here is a monthly chart since 1980, as depicted on a LOG scale.  It is interestingly to compare how Gold's rise has correlated with U.S. "reflationary" efforts over the last 10 years:


Now onto Part III, a look at the bond market and interest rates...
_____
A Special Note concerning our economic situation is found here
SPX at 1183.08 as this post is written

Wednesday, April 28, 2010

Home Prices Vs. Gold

On April 23, chartoftheday.com had an interesting chart, shown below, that compares the median home price vs. the price of Gold:


Traditionally, houses have been viewed as "hard assets." However, as one can see above, their recent (from a long-term historical perspective) price pattern seems more geared to that of a "paper asset" - i.e. strong performance during the '80s and '90s, while significantly underperforming Gold for roughly 7 years.

There are many other observations and interpretations that can be made from this ratio as well. It certainly "frames" home prices in a different light, especially from an investment standpoint.

Going forward, it will be interesting to see how this ratio evolves...

________


SPX at 1189.38 as this post is written
Friday, February 12, 2010

Gold And Gold Stocks

I have made various comments about Gold over the last few months.

One aspect during Gold's price increase that I have noted as disconcerting is the relative lagging performance of the Gold stocks. I use the HUI index as a proxy for Gold stocks.

As one can see on the daily chart below, the Gold price is reflected in the top of the chart, followed by the HUI:Gold ratio and then HUI in green:


chart courtesy of StockCharts.com

The HUI index has lagged since approximately the beginning of 2008. Perhaps the main question is if/when might it start performing better? One potentially bullish sign is a potential Cup and Handle formation with the two peaks above 500 and current upswing serving as the "lid" and "handle" of the Cup and Handle formation, respectively.

Of course, this Cup and Handle formation is very tentative at this time. It is simply something to monitor. However, should this C&H formation "play out" with the HUI strongly advancing above the prior peaks above 500, one could reasonably expect the gold price to react positively if not very much so. Should it not play out, i.e. the HUI price falters or declines from here, would likely be a bearish omen for Gold.

As I have pointed out in previous posts, Gold's price can have very important implications from many financial and economic perspectives. However, due to the complexity of the factors that determine Gold's price, it can be very difficult to predict its price movements.


SPX at 1066.43 as this post is written

Wednesday, February 3, 2010

Two Other Views Of The Gold Price

I find a periodic review of Gold's price relative to the Dow Jones Industrials' and to Crude Oil's interesting.

Below is a long-term monthly chart of the Dow Jones Industrial Average price relative to that of Gold's. As one can see, Gold has been outperforming since roughly 2001, after underperforming from roughly 1981-2000:


chart courtesy of StockCharts.com

Below is a long-term monthly chart of the Crude Oil price relative to that of Gold's. As one can see, the Gold price has been bouncing around in a range since 1990, and is now at a slightly subdued level:


chart courtesy of StockCharts.com

One can infer many different things from these two charts. With regard to the first chart, one way to view this is to see how "hard assets" are performing relative to "paper assets." With regard to the above chart, one can see how Gold is performing to another commodity, crude oil. From this crude oil to Gold price comparison, one may interpret Gold's unique "safe haven" value. If one chooses to view the chart in this manner, one could draw the conclusion that from a "safe haven" standpoint, Gold's price is not reflecting much of a "safe haven" value. This view is consistent with previous comments I have made with regard to Gold.

I strongly believe that the strongest driver of Gold's price (especially relative to other assets) will be if/when it is viewed as the ultimate "safe haven" asset. This condition would likely occur concomitant to a repudiation of "paper" assets.


SPX at 1098.76 as this post is written

Tuesday, November 24, 2009

Another Thought On Gold

A November 20 Wall Street Journal article stated that Gold's January 1980 record high would have an inflation-adjusted equivalent of $2,290/oz.

I find it amazing that even after the long parabolic rise we have seen in Gold since 2001, we are still far short of that inflation-adjusted price. On an "all things considered" basis one would have thought that Gold would have performed stronger over the last 30 or so years. The Gold price really went into submission from 1980-2000.

I think it underscores the fact that at least from a historical perspective of the last few decades, it has been very important as to when Gold is purchased.

I mention this as Gold appears overdue for at least some type of correction. The recent price action, resulting with Gold now at $1169 (December futures) has been strongly parabolic.

I think that many factors are now in play that will generate considerable volatility in Gold's price going forward.

Gold's price should be very interesting to watch, and I think it carries great significance on a number of fronts.


SPX at 1106.24 as this post is written

Friday, November 20, 2009

Is Gold Experiencing A Bubble?

One of the questions that frequently arises with Gold's recent strong performance is "Is Gold in a bubble?"

Before I make some comments concerning this question, here is a long-term monthly chart of Gold for reference:


Chart Courtesy of StockCharts.com

Anytime a security acts as strongly as Gold has, it is natural to suspect a bubble. This is especially true with Gold's price currently, as many people don't understand the complexity of the factors that can drive Gold's price.

As I have previously noted in various blog posts (which can be found under the "Investor" Category on the right-hand side of the home page) Gold's price can be very hard to predict. To a greater extent than other securities, there are many different, hard-to-quantify factors that can drive the Gold price.

Furthermore, the market for Gold is relatively small in relation to other asset markets, so investment flows both in and out of Gold can be magnified.

Is Gold in a bubble? Given the aforementioned, I would hesitate to make an affirmative declaration. This is not to say that it is not overvalued or "ahead of itself." As I wrote in a September 25 post, "I like Gold's properties. However, I don't believe that the economic factors now in existence support a strong Gold price, from an 'all things considered' basis."

Perhaps the greater question should be whether various asset classes are currently experiencing bubbles, and whether Gold is just one of a few (or many) classes in such a condition. In effect, is Gold's price strongly (positively) correlated to that of other asset classes, and if so, why?


SPX at 1091.01 as this post is written

Tuesday, November 17, 2009

Gold And XLF

One of the charts that I follow is the ratio of Gold to XLF. As XLF is a prominent ETF of the financial stocks, it can serve as a proxy to "paper assets."

While I think it is difficult to make concrete conclusions based upon the Gold:XLF chart, I think it does provide a "feel" for some aspects of Gold's performance.

Here is the daily chart from 2007:


Chart Courtesy of StockCharts.com

In the above chart, Gold:XLF is plotted highest, with Gold and XLF plotted separately below. I find it interesting that while Gold's price has been performing strongly recently, the peak in the Gold:XLF ratio actually came in March. This seems to cast doubt upon the idea that Gold's recent strong performance is being driven by its "safe haven" qualities. As I commented in my November 10 post on Gold:

"In effect, could the current strong performance of Gold somehow be a precursor of (more) economic problems? The answer ... can certainly be “yes.” However, if so, it would be odd to have Gold rising strongly at the same time low quality paper assets have been rising strongly as well. From a long-term historical perspective, usually Gold’s “safe haven” qualities are most highly valued when “paper” assets are suffering."

Many people have traditionally viewed Gold as an "alternative" asset - one that should hold its value if other asset values fell. Given Gold's performance over the last few years, a Gold investor should assess if such an inverse relationship still exists, or if Gold has somehow transmogrified into just another asset that is (highly) correlated with all other assets.


SPX at 1107.02 as this post is written

Tuesday, November 10, 2009

A Few Comments About Gold

Gold's recent price performance has been very strong.

There are, however, quite a few indicators that, from a historical perspective, seem to disconfirm Gold's current price, which as I write this is $1101 for the December futures contract.

One of the factors that seems to be speaking against Gold is the lagging performance of the HUI Index. As I wrote in the June 16 blog post:

"One measure that I follow is the ratio of HUI (an index of gold stocks) to that of the physical metal itself. One theory, perhaps the predominant one, is that the gold stocks should move, or at least verify, the price movements of the physical gold itself. Looking at the weekly chart (seen below) over the last 10 years seems to indicate that although gold has been relatively buoyant over the last year, the gold stocks, as seen by the HUI Index, have lagged since early 2008. One interpretation of this is that the gold stocks are not confirming the move in gold, meaning that gold may soon head down..."

Although Gold has continued to head up, as one can see in the chart below, the HUI:Gold ratio continues to lag and is at subdued (relative to the last ten years') levels:


Chart Courtesy of StockCharts.com

I find the lagging performance of the Gold stocks, as seen by the HUI Index, to be very conspicuous. This is especially so given the current investment environment where investors have shown they are even willing to aggressively bid up prices for securities that possess the most dubious of fundamental value.

In my opinion, predicting Gold's price has always been difficult. There are a variety of reasons for this, including the fact that the markets for both physical Gold and Gold stocks are relatively small. It doesn't take large investment inflows, or outflows, to move the price significantly.

Of course, Gold can be viewed as the ultimate "safe haven" security. Placing a value on this "safe haven" aspect is very difficult. Could Gold's current price be reflecting a significant "safe haven" premium? In effect, could the current strong performance of Gold somehow be a precursor of (more) economic problems? The answer to both of these questions can certainly be "yes." However, if so, it would be odd to have Gold rising strongly at the same time low quality paper assets have been rising strongly as well. From a long-term historical perspective, usually Gold's "safe haven" qualities are most highly valued when "paper" assets are suffering.

Gold's price action should be interesting going forward...


SPX at 1093.69 as this post is written

Friday, September 25, 2009

Gold Below $1000

With Gold now below $1000, I would like to call attention to a post of September 4 titled "Gold and Implications."

I think that Gold below $1000, after having failed to hold above this level, is very significant.

Also significant is the number of people who have been predicting a Gold price considerably higher than $1000, many saying Gold will reach $2000 to $5000/oz.

I like Gold's properties. However, I don't believe that the economic factors now in existence support a strong Gold price, from an "all things considered" basis.

Gold's price is particularly hard to predict, because there is always a "fear factor premium" that may assert itself. While this "fear factor premium" seems to have diminished over the last couple of decades, it can always reassert itself in times of panic. However, I think it was very significant that during the Financial Crisis of the second half of 2008 (especially July - October), Gold faired poorly, which in my mind does not bode well for Gold's "fear factor premium" at least in the near term.

SPX at 1050.78 as this post is written

Tuesday, June 30, 2009

Gold and Inflation

Gold and Inflation
Tuesday, June 16th, 2009

Much has been written in the financial press about the possibility of impending inflation, or even hyperinflation. These possibilities are discussed as being likely due to the “loose” monetary policy that has been enacted to combat The Financial Crisis.

If one were to believe that inflation has or will soon “breakout,” one would probably expect gold to perform strongly. At around the current 930 level, gold has “held its own” over the last year, but certainly hasn’t put in what might be called a strong performance, all things considered.

One measure that I follow is the ratio of HUI (an index of gold stocks) to that of the physical metal itself. One theory, perhaps the predominant one, is that the gold stocks should move, or at least verify, the price movements of the physical gold itself. Looking at the weekly chart (seen below) over the last 10 years seems to indicate that although gold has been relatively buoyant over the last year, the gold stocks, as seen by the HUI Index, have lagged since early 2008. One interpretation of this is that the gold stocks are not confirming the move in gold, meaning that gold may soon head down, which could indicate that inflation fears are overstated.

The inflation/reflation/deflation issue is critical to The Financial Crisis. Most people with an opinion on the matter think that deflation isn’t a major threat. While the HUI:Gold ratio is only one measure that can be used, it is important to see what it is indicating at the moment with regard to the inflation/reflation/deflation issue.

(click on chart to enlarge image)


Chart courtesy of StockCharts.com