Along these lines, one of the measures showing disconcerting trends is that of hourly earnings.
While the concept of hourly earnings can be defined and measured in a variety of ways, below are a few charts that I believe broadly illustrate problematic trends.
The first chart depicts Average Hourly Earnings Of All Employees: Total Private (FRED series CES0500000003)(current value = $26.25):
(click on chart to enlarge image)(chart last updated 7-7-17)
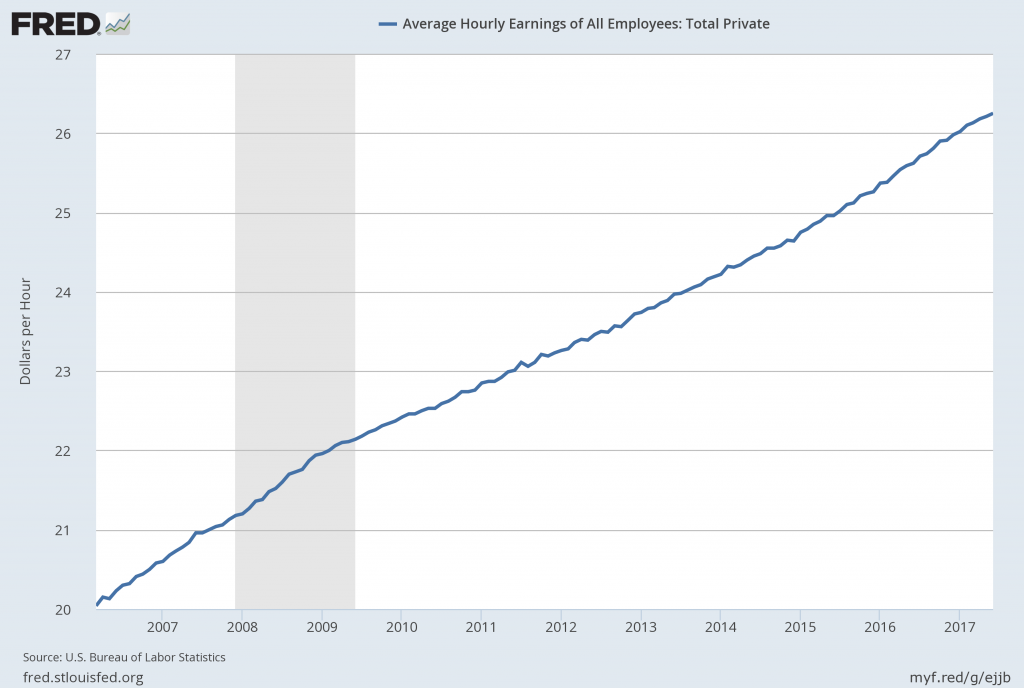
Data Source: FRED, Federal Reserve Economic Data, Federal Reserve Bank of St. Louis: Average Hourly Earnings of All Employees: Total Private [CES0500000003] ; U.S. Department of Labor: Bureau of Labor Statistics; accessed July 7, 2017:
http://research.stlouisfed.org/fred2/series/CES0500000003
–
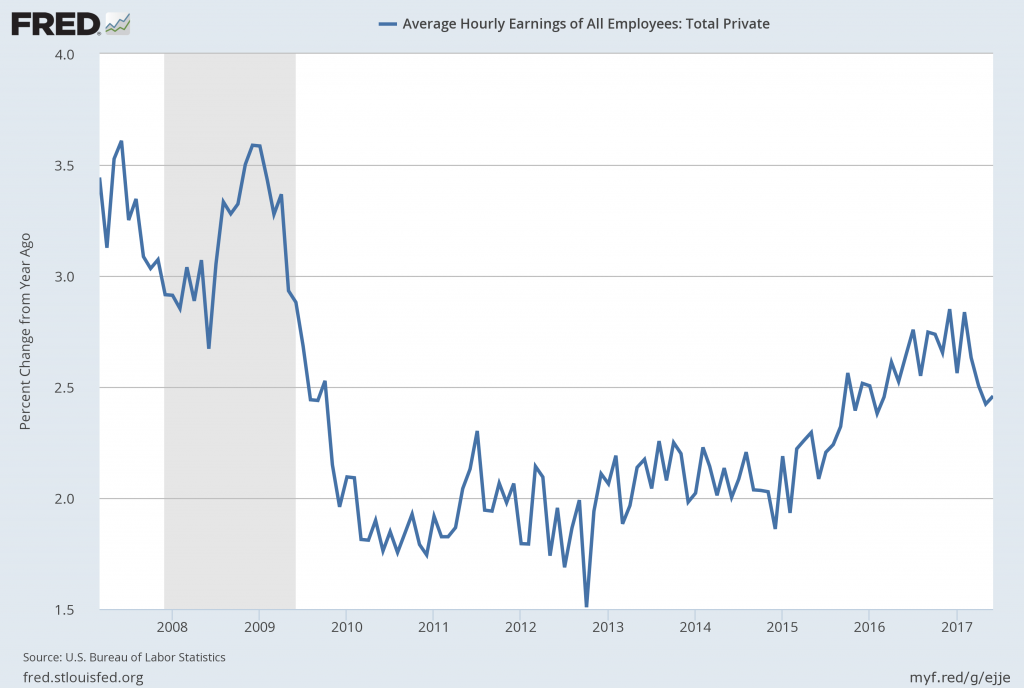
This next chart depicts this same measure on a “Percentage Change From A Year Ago” basis. While not totally surprising, I find the decline from 2009 and subsequent trend to be disconcerting:
(click on chart to enlarge image)(chart last updated 7-7-17)
–
There are slightly different measures available from a longer-term perspective. Pictured below is another measure, the Average Hourly Earnings of Production and Nonsupervisory Employees – Total Private (FRED series AHETPI)(current value = $22.03):
(click on chart to enlarge image)(chart last updated 7-7-17)
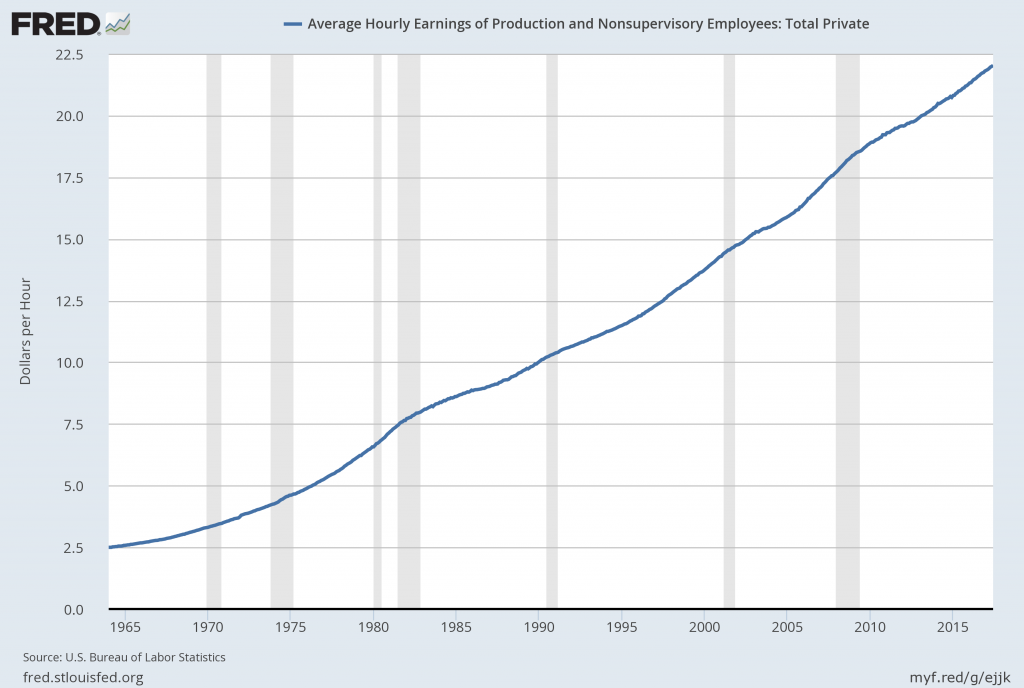
Data Source: FRED, Federal Reserve Economic Data, Federal Reserve Bank of St. Louis: Average Hourly Earnings of Production and Nonsupervisory Employees: Total Private [AHETPI] ; U.S. Department of Labor: Bureau of Labor Statistics; accessed July 7, 2017:
http://research.stlouisfed.org/fred2/series/AHETPI
–
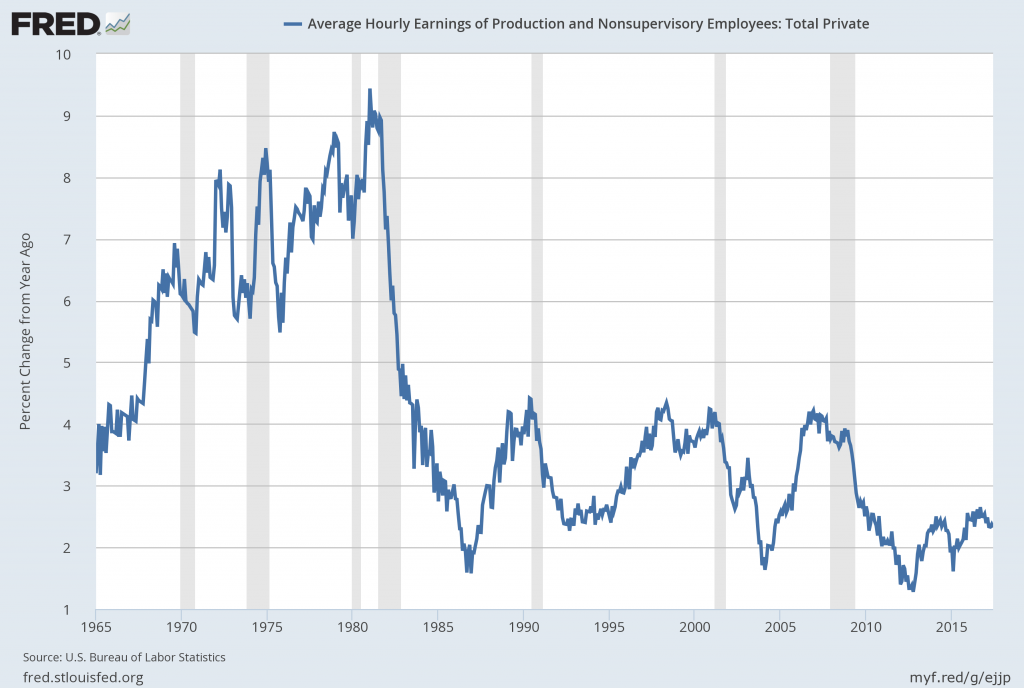
Pictured below is this AHETPI measure on a “Percentage Change From A Year Ago” basis. While not totally surprising, I find the decline from 2009 and subsequent trend to be disconcerting:
(click on chart to enlarge image)(chart last updated 7-7-17)
–
I will continue to actively monitor these trends, especially given the post-2009 dynamics.
_________
I post various economic indicators and indices because I believe they should be carefully monitored. However, as those familiar with this site are aware, I do not necessarily agree with what they depict or imply.
_____
The Special Note summarizes my overall thoughts about our economic situation
SPX at 2423.53 this post is written
No comments:
Post a Comment