U.S. Economic Indicators
Throughout this site there are many discussions of economic indicators. At this time, the readings of various indicators are especially notable. This post is the latest in a series of posts indicating U.S. economic weakness or a notably low growth rate.
While many U.S. economic indicators – including GDP – are indicating economic growth, others depict (or imply) various degrees of weak growth or economic contraction. As seen in the January 2020 Wall Street Journal Economic Forecast Survey the consensus (average estimate) among various economists is for 2.3% GDP growth in 2019 and 1.9% GDP growth in 2020. However, there are other broad-based economic indicators that seem to imply a weaker growth rate.
As well, it should be remembered that GDP figures can be (substantially) revised.
Charts Indicating U.S. Economic Weakness
Below are a small sampling of charts that depict weak growth or contraction, and a brief comment for each:
Total Federal Receipts
“Total Federal Receipts” growth continues to be intermittent in nature since 2015. As well, the level of growth does not seem congruent to the (recent) levels of economic growth as seen in aggregate measures such as Real GDP.
“Total Federal Receipts” through January had a last monthly value of $372,288 Million. Shown below is the measure displayed on a “Percent Change From Year Ago” basis with value 9.5%, last updated February 12, 2020:
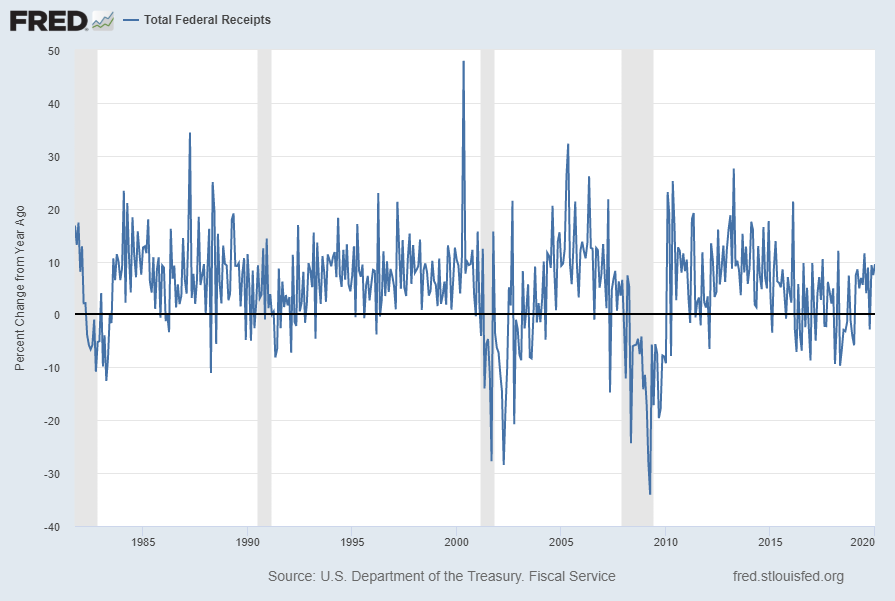
source: U.S. Department of the Treasury. Fiscal Service, Total Federal Receipts [MTSR133FMS], retrieved from FRED, Federal Reserve Bank of St. Louis; accessed February 12, 2020:
https://fred.stlouisfed.org/series/MTSR133FMS
https://fred.stlouisfed.org/series/MTSR133FMS
__
The Chicago Fed National Activity Index (CFNAI)
A broad-based economic indicator that has been implying weaker growth or mild contraction is the Chicago Fed National Activity Index (CFNAI).
The January 2020 Chicago Fed National Activity Index (CFNAI) updated as of January 22, 2020:
The CFNAI, with current reading of -.35:
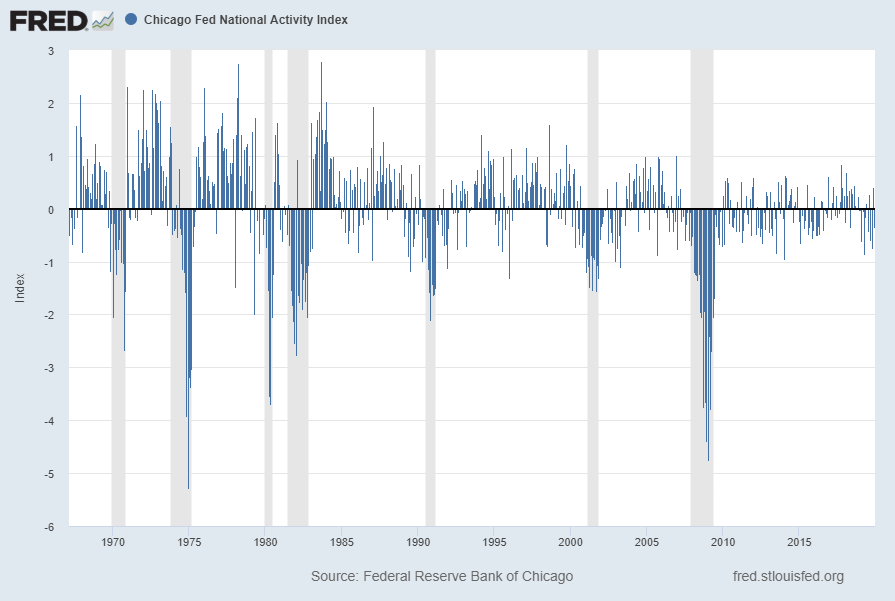
source: Federal Reserve Bank of Chicago, Chicago Fed National Activity Index [CFNAI], retrieved from FRED, Federal Reserve Bank of St. Louis, January 22, 2020;
https://fred.stlouisfed.org/series/CFNAI
https://fred.stlouisfed.org/series/CFNAI
The CFNAI-MA3, with current reading of -.23:
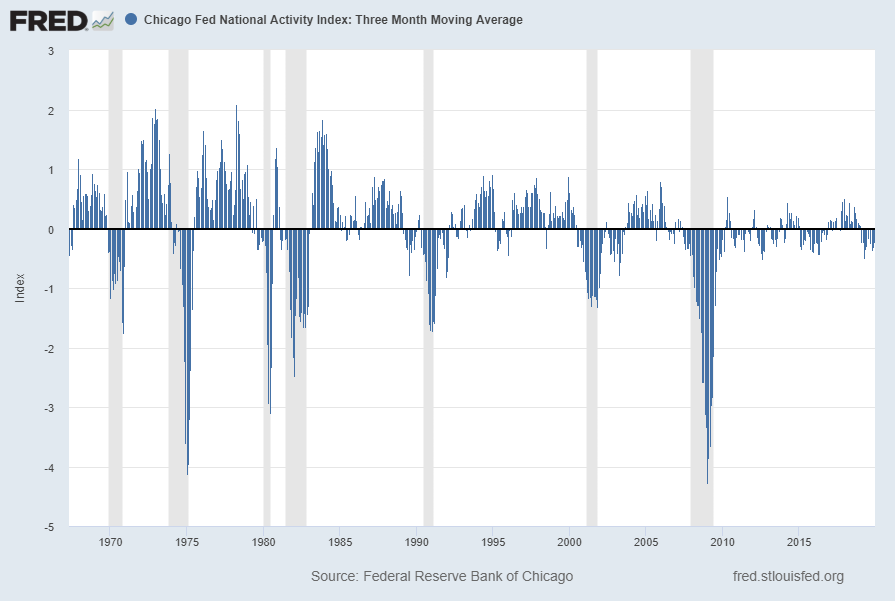
source: Federal Reserve Bank of Chicago, Chicago Fed National Activity Index: Three Month Moving Average [CFNAIMA3], retrieved from FRED, Federal Reserve Bank of St. Louis, January 22, 2020;
https://fred.stlouisfed.org/series/CFNAIMA3
https://fred.stlouisfed.org/series/CFNAIMA3
__
The Yield Curve
Many people believe that the Yield Curve is a leading economic indicator for the United States economy.
On March 1, 2010, I wrote a post on the issue, titled “The Yield Curve As A Leading Economic Indicator.”
While I continue to have the stated reservations regarding the “Yield Curve” as an indicator, I do believe that it should be monitored.
Various portions of the U.S. Yield Curve have been showing intermittent or prolonged inversions. Below is the spread between 10-Year Treasury Constant Maturity and the 3-Month Treasury Constant Maturity from 1982 through the February 11, 2020 value, showing a value of .02 (10-Year Treasury Yield (FRED DGS10) of 1.56% , 3-Month Treasury Yield (FRED DGS3MO) of 1.58%):
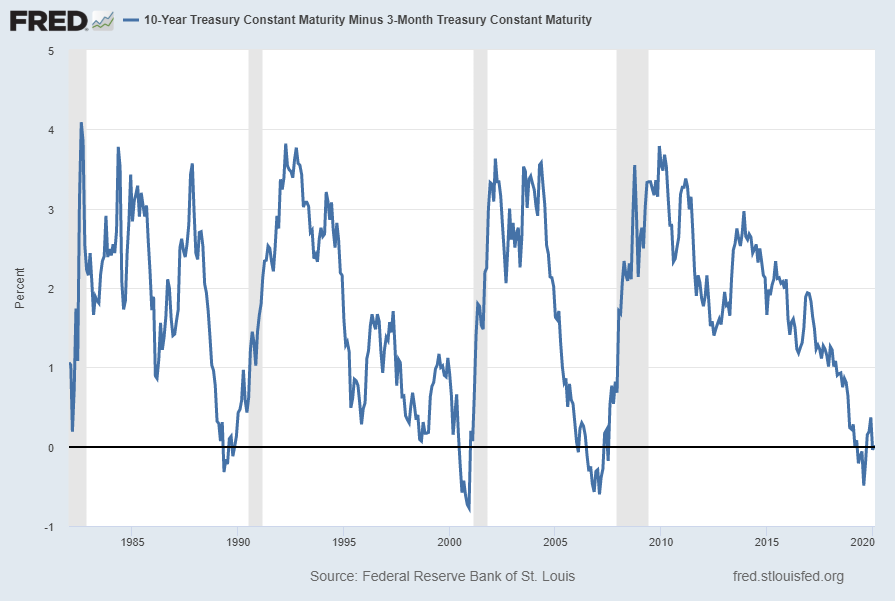
source: Federal Reserve Bank of St. Louis, 10-Year Treasury Constant Maturity Minus 3-Month Treasury Constant Maturity [T10Y3M], retrieved from FRED, Federal Reserve Bank of St. Louis; accessed February 12, 2020: https://fred.stlouisfed.org/series/T10Y3M
__
Loan Demand And Related Measures
As seen in previous updates, various aspects of lending growth and related measures have shown a contraction. Shown below is a measure, Net Percentage of Domestic Banks Reporting Stronger Demand for Commercial and Industrial Loans from Large and Middle-Market Firms [DRSDCILM], that shows a decline. The current value is -11.1% as of the February 3, 2020 quarterly update:
![Net Percentage of Domestic Banks Reporting Stronger Demand for Commercial and Industrial Loans from Large and Middle-Market Firms [DRSDCILM]](https://www.economicgreenfield.com/wp-content/uploads/2020/02/DRSDCILM_2-3-20-11.1-Percent.png)
source: Board of Governors of the Federal Reserve System (US), Net Percentage of Domestic Banks Reporting Stronger Demand for Commercial and Industrial Loans from Large and Middle-Market Firms [DRSDCILM], retrieved from FRED, Federal Reserve Bank of St. Louis; accesssed February 12, 2020: https://fred.stlouisfed.org/series/DRSDCILM
__
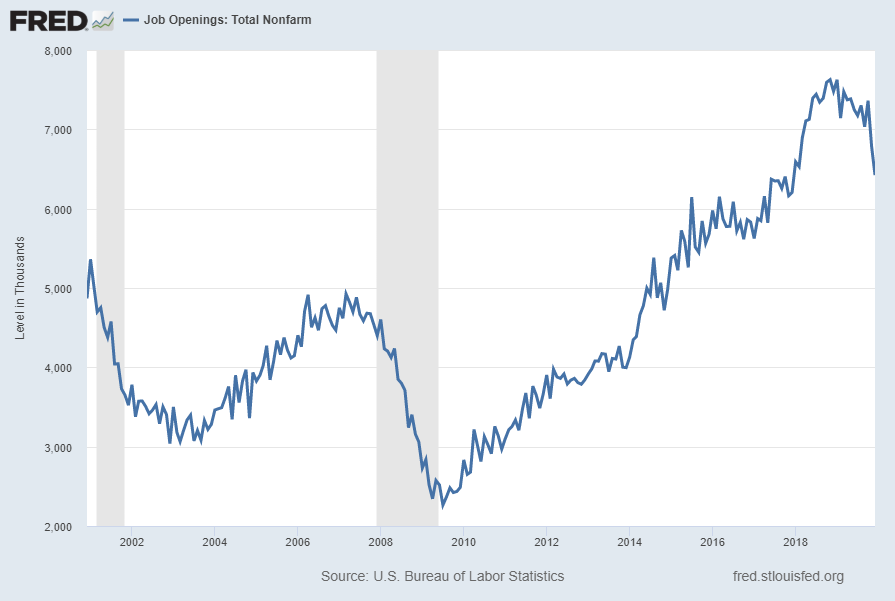
Job Openings
Job openings, (Job Openings: Total Nonfarm [JTSJOL]) although still at a high level, have recently declined significantly. This Job Openings measure had a value of 6423 (Thousands) through December, as of the February 11, 2020 update, as shown below:
Shown below is this measure displayed on a “Percent Change From Year Ago” basis with value -14.1%:
![Job Openings: Total Nonfarm [JTSJOL] Percent Change From Year Ago](https://www.economicgreenfield.com/wp-content/uploads/2020/02/JTSJOL_2-11-20-6423-14.1-Percent-Change-From-Year-Ago.png)
source: U.S. Bureau of Labor Statistics, Job Openings: Total Nonfarm [JTSJOL], retrieved from FRED, Federal Reserve Bank of St. Louis; accessed February 12, 2020: https://fred.stlouisfed.org/series/JTSJOL
__
Other Indicators
As mentioned previously, many other indicators discussed on this site indicate weak economic growth or economic contraction, if not outright (gravely) problematical economic conditions.
_____
The Special Note summarizes my overall thoughts about our economic situation
SPX at 3379.45 as this post is written
No comments:
Post a Comment