The following is an update of various indicators that are supposed to predict and/or depict economic activity. These indicators have been discussed in previous blog posts:
The February 2020 Chicago Fed National Activity Index (CFNAI) updated as of February 24, 2020:
The CFNAI, with current reading of -.25:
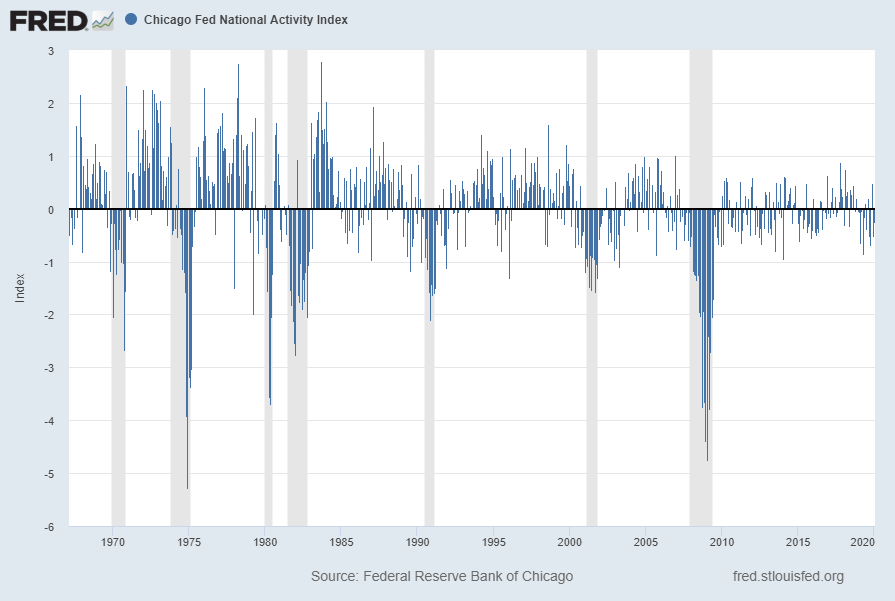
source: Federal Reserve Bank of Chicago, Chicago Fed National Activity Index [CFNAI], retrieved from FRED, Federal Reserve Bank of St. Louis, February 24, 2020;
https://fred.stlouisfed.org/series/CFNAI
https://fred.stlouisfed.org/series/CFNAI
The CFNAI-MA3, with current reading of -.09:
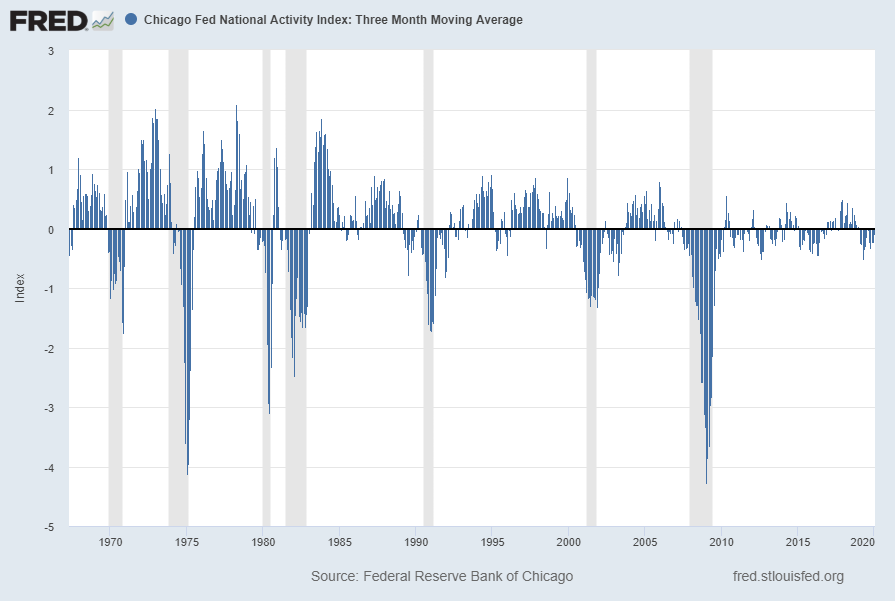
source: Federal Reserve Bank of Chicago, Chicago Fed National Activity Index: Three Month Moving Average [CFNAIMA3], retrieved from FRED, Federal Reserve Bank of St. Louis, February 24, 2020;
https://fred.stlouisfed.org/series/CFNAIMA3
https://fred.stlouisfed.org/series/CFNAIMA3
–
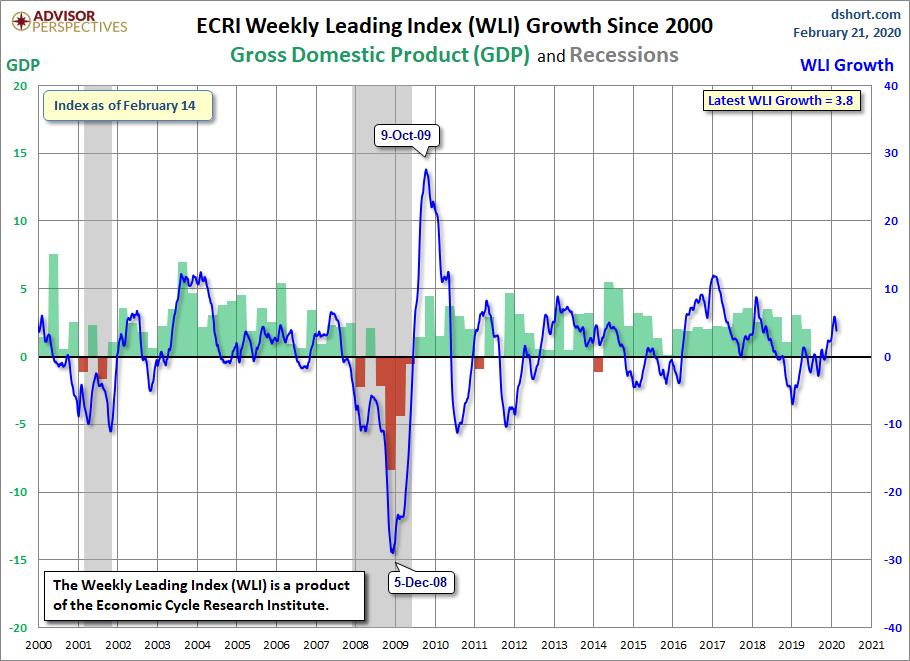
As of February 21, 2020 (incorporating data through February 14, 2020) the WLI was at 147.7 and the WLI, Gr. was at 3.8%.
A chart of the WLI,Gr., from the Doug Short site’s ECRI update post of February 21, 2020:
–
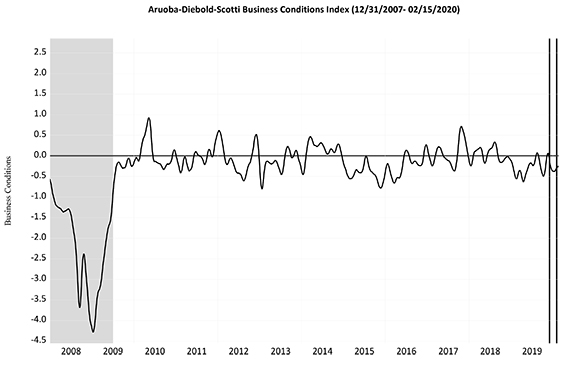
Below is the latest chart, depicting the ADS Index from December 31, 2007 through February 15, 2020:
–
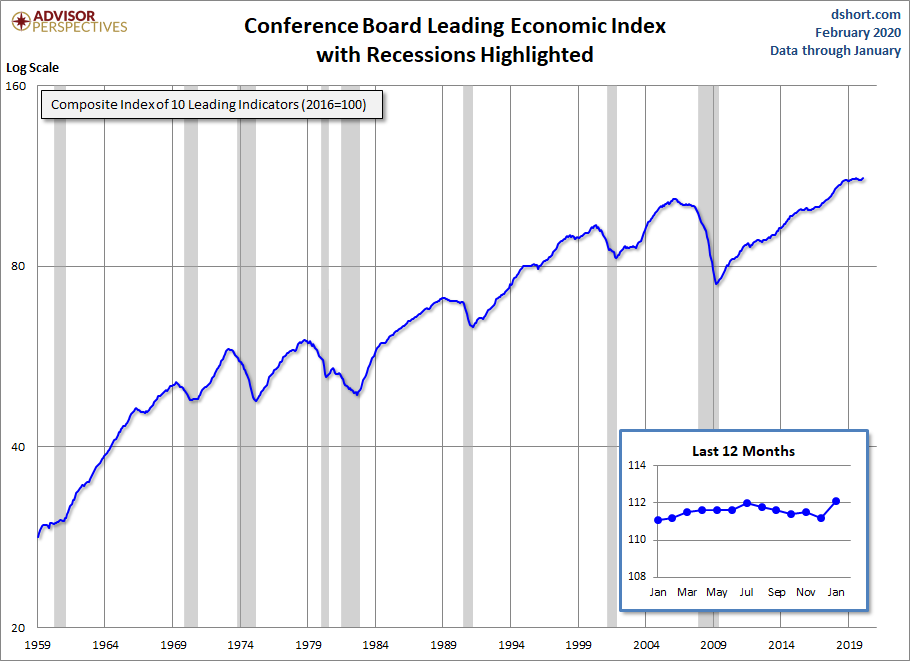
The Conference Board Leading (LEI), Coincident (CEI) Economic Indexes, and Lagging Economic Indicator (LAG):
As per the February 20, 2020 Conference Board press release, titled “The Conference Board Leading Economic Index (LEI) for the U.S. Increased in January” the LEI was at 112.1, the CEI was at 107.3, and the LAG was 108.7 in January.
An excerpt from the release:
“The strong pickup in the January US LEI was driven by a sharp drop in initial unemployment insurance claims, increasing housing permits, consumers’ outlook on the economy and financial indicators,” said Ataman Ozyildirim, Senior Director of Economic Research at The Conference Board. “The LEI’s six-month growth rate has returned to positive territory, suggesting that the current economic expansion – at about 2 percent – will continue through early 2020. While weakness in manufacturing appears to show signs of softening, the COVID-19 outbreak may impact manufacturing supply chains in the US in the coming months.”
Here is a chart of the LEI from the Doug Short site Conference Board Leading Economic Index update of February 20, 2020:
_________
I post various indicators and indices because I believe they should be carefully monitored. However, as those familiar with this site are aware, I do not necessarily agree with what they depict or imply.
_____
The Special Note summarizes my overall thoughts about our economic situation
SPX at 3234.52 as this post is written
No comments:
Post a Comment