For a variety of reasons, I am not as enamored with ECRI’s WLI and WLI Growth measures as many are.
However, I do think the measures are important and deserve close monitoring and scrutiny.
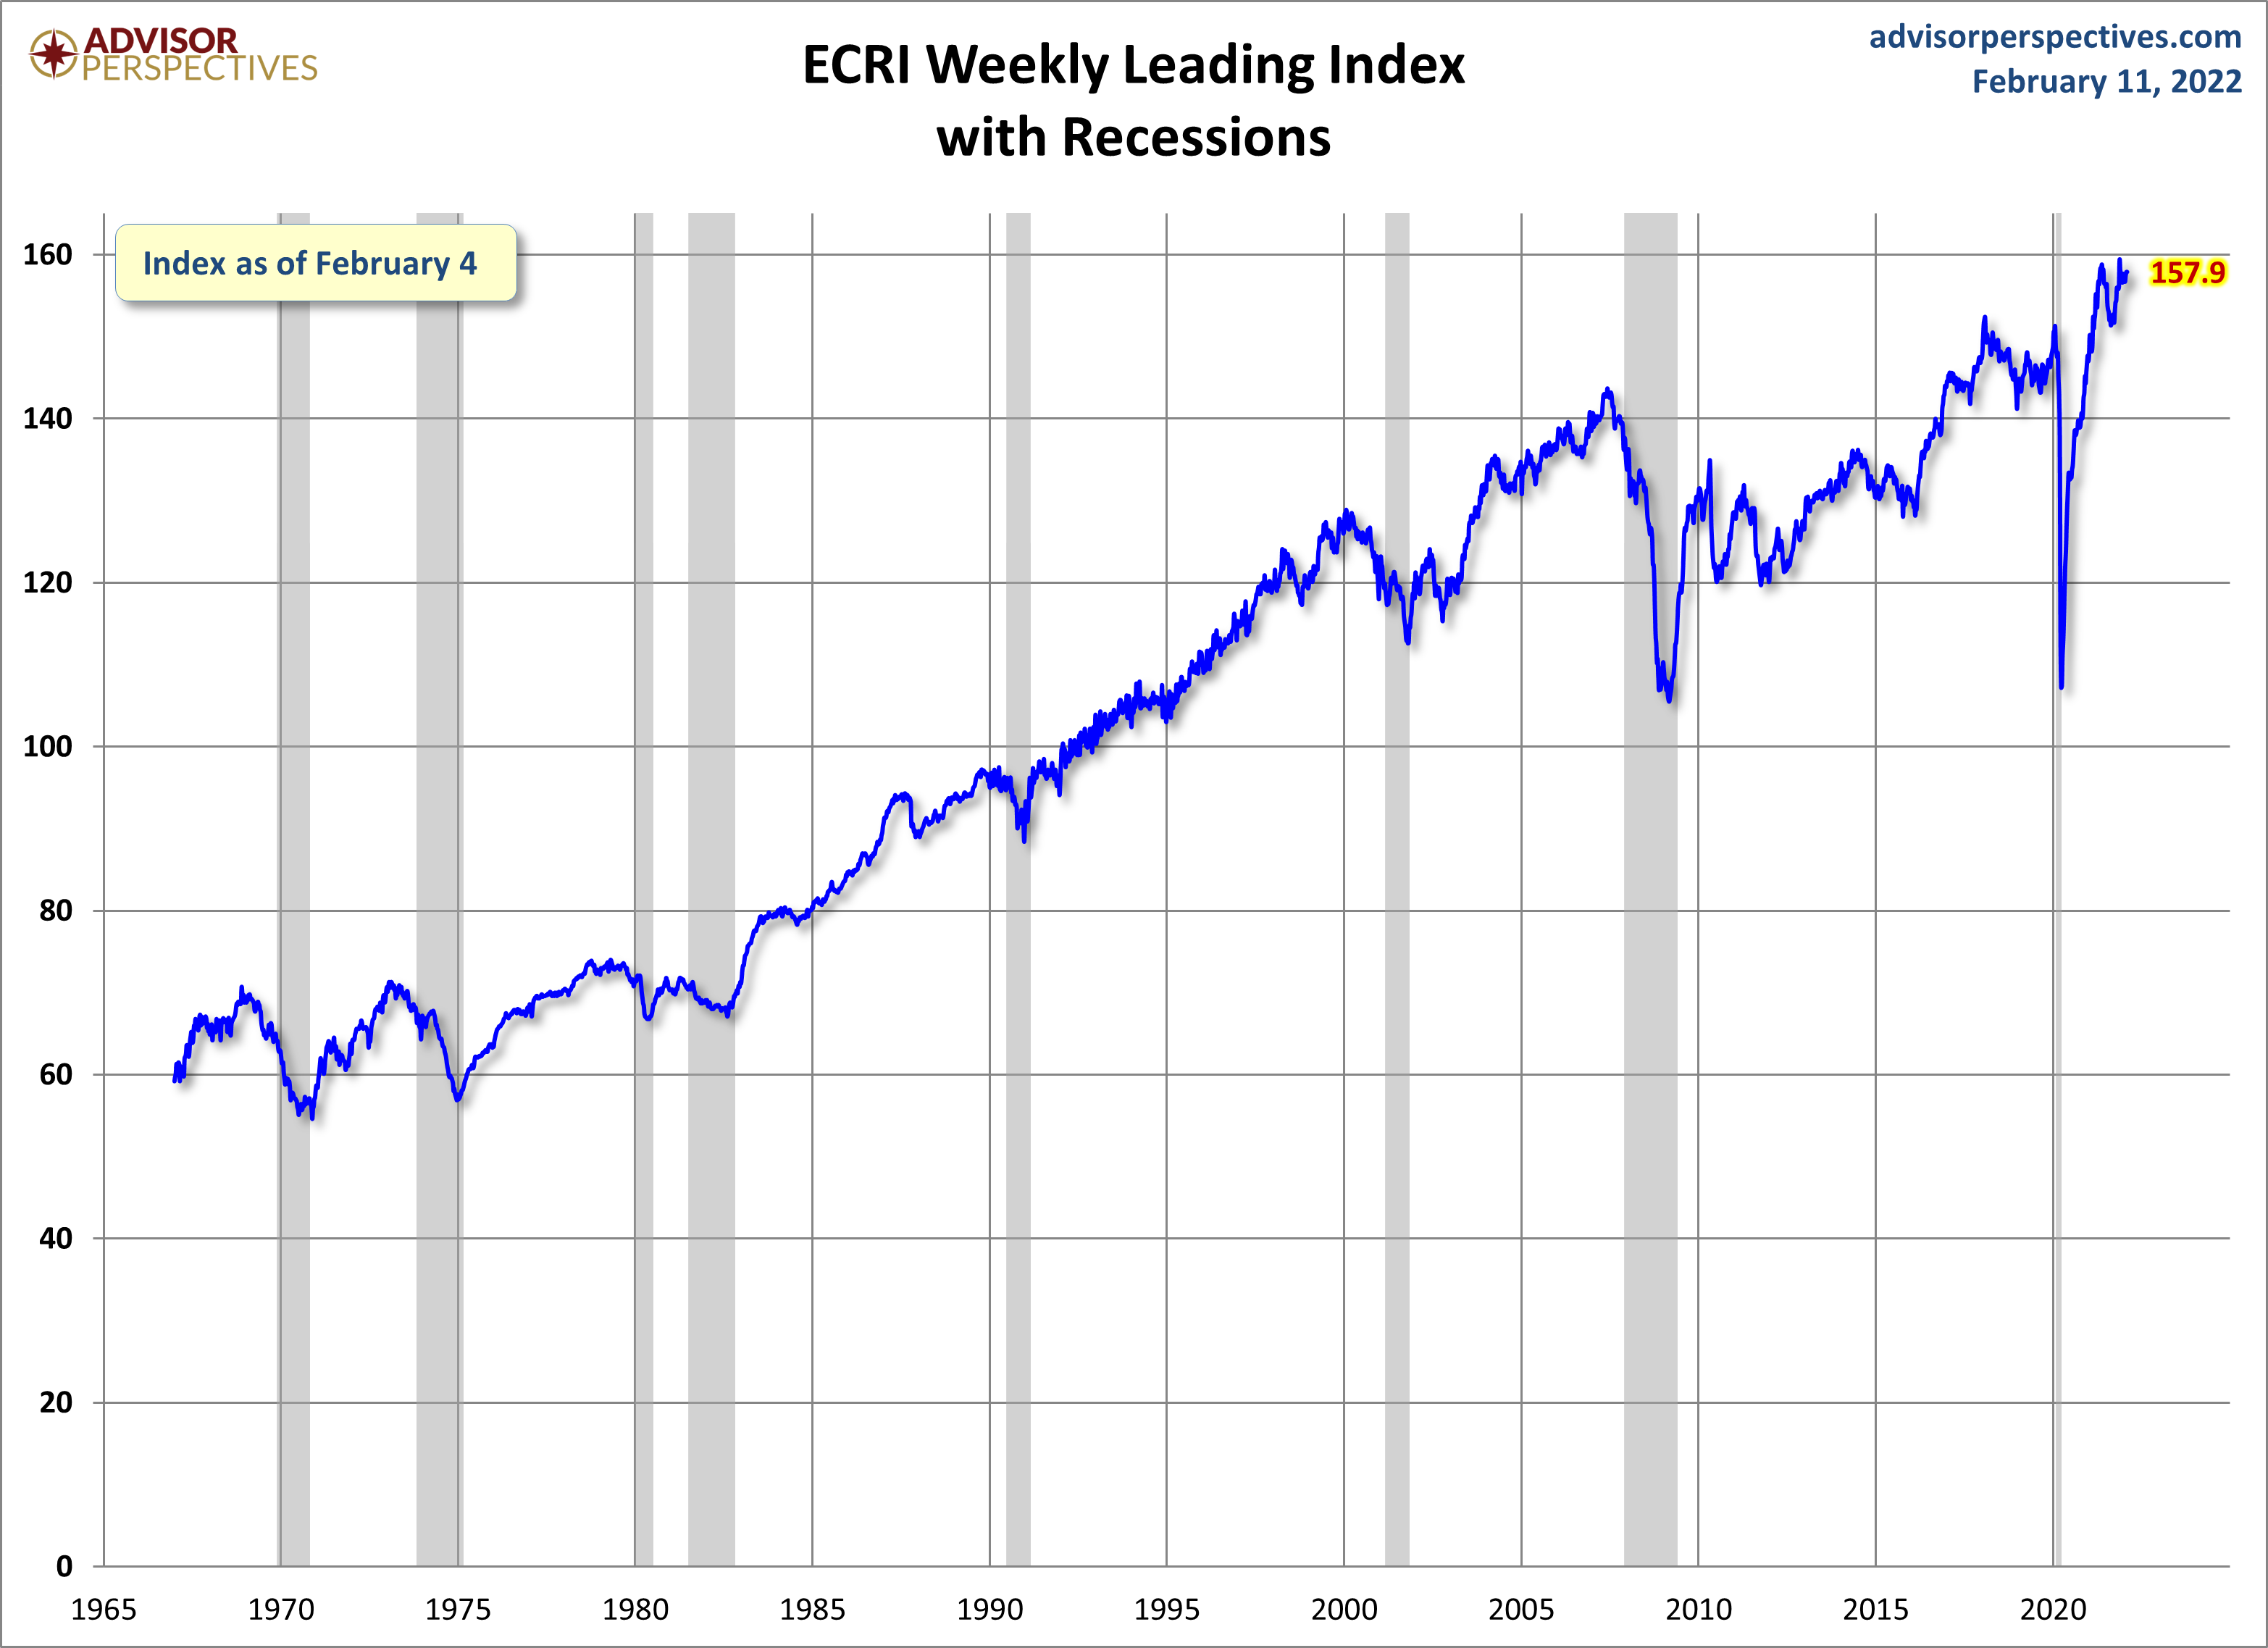
Below are three long-term charts, from Advisor Perspectives’ ECRI update post of February 11, 2022 titled “ECRI Weekly Leading Index Update.” These charts are on a weekly basis as of the February 11, 2022 release, reflecting data through February 4, 2022.
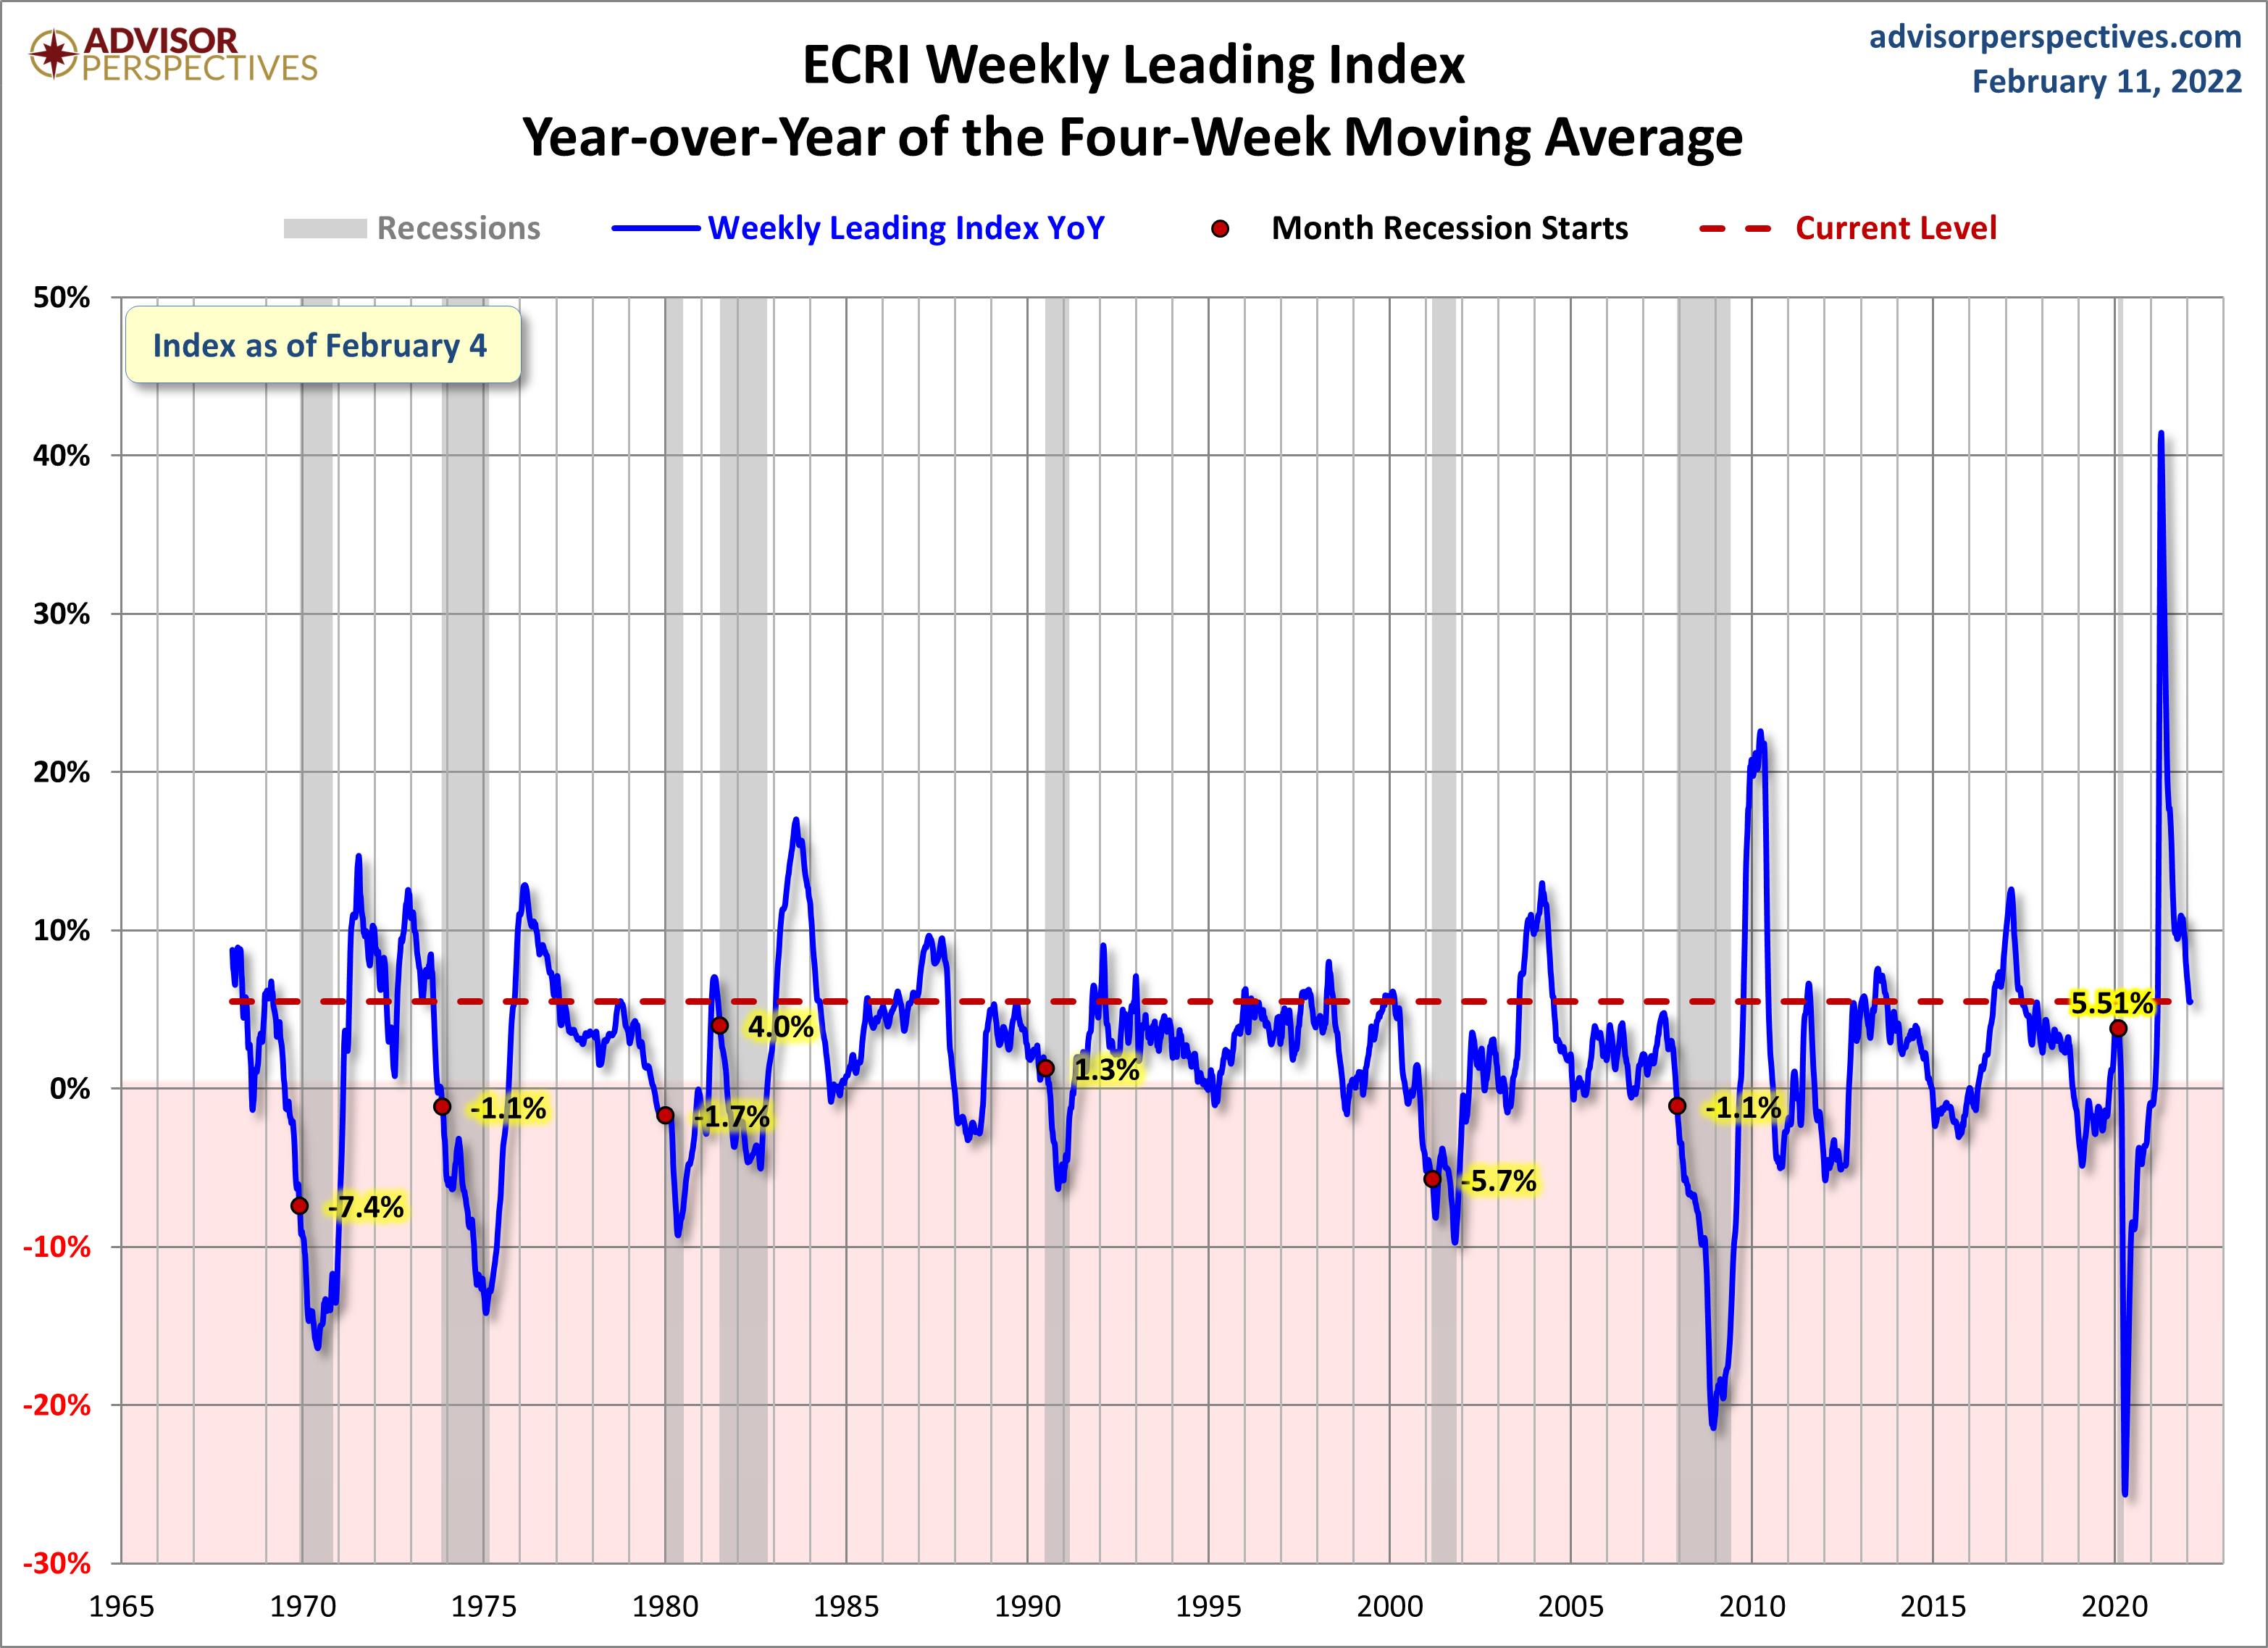
This next chart depicts, on a long-term basis, the Year-over-Year change in the 4-week moving average of the WLI:
–
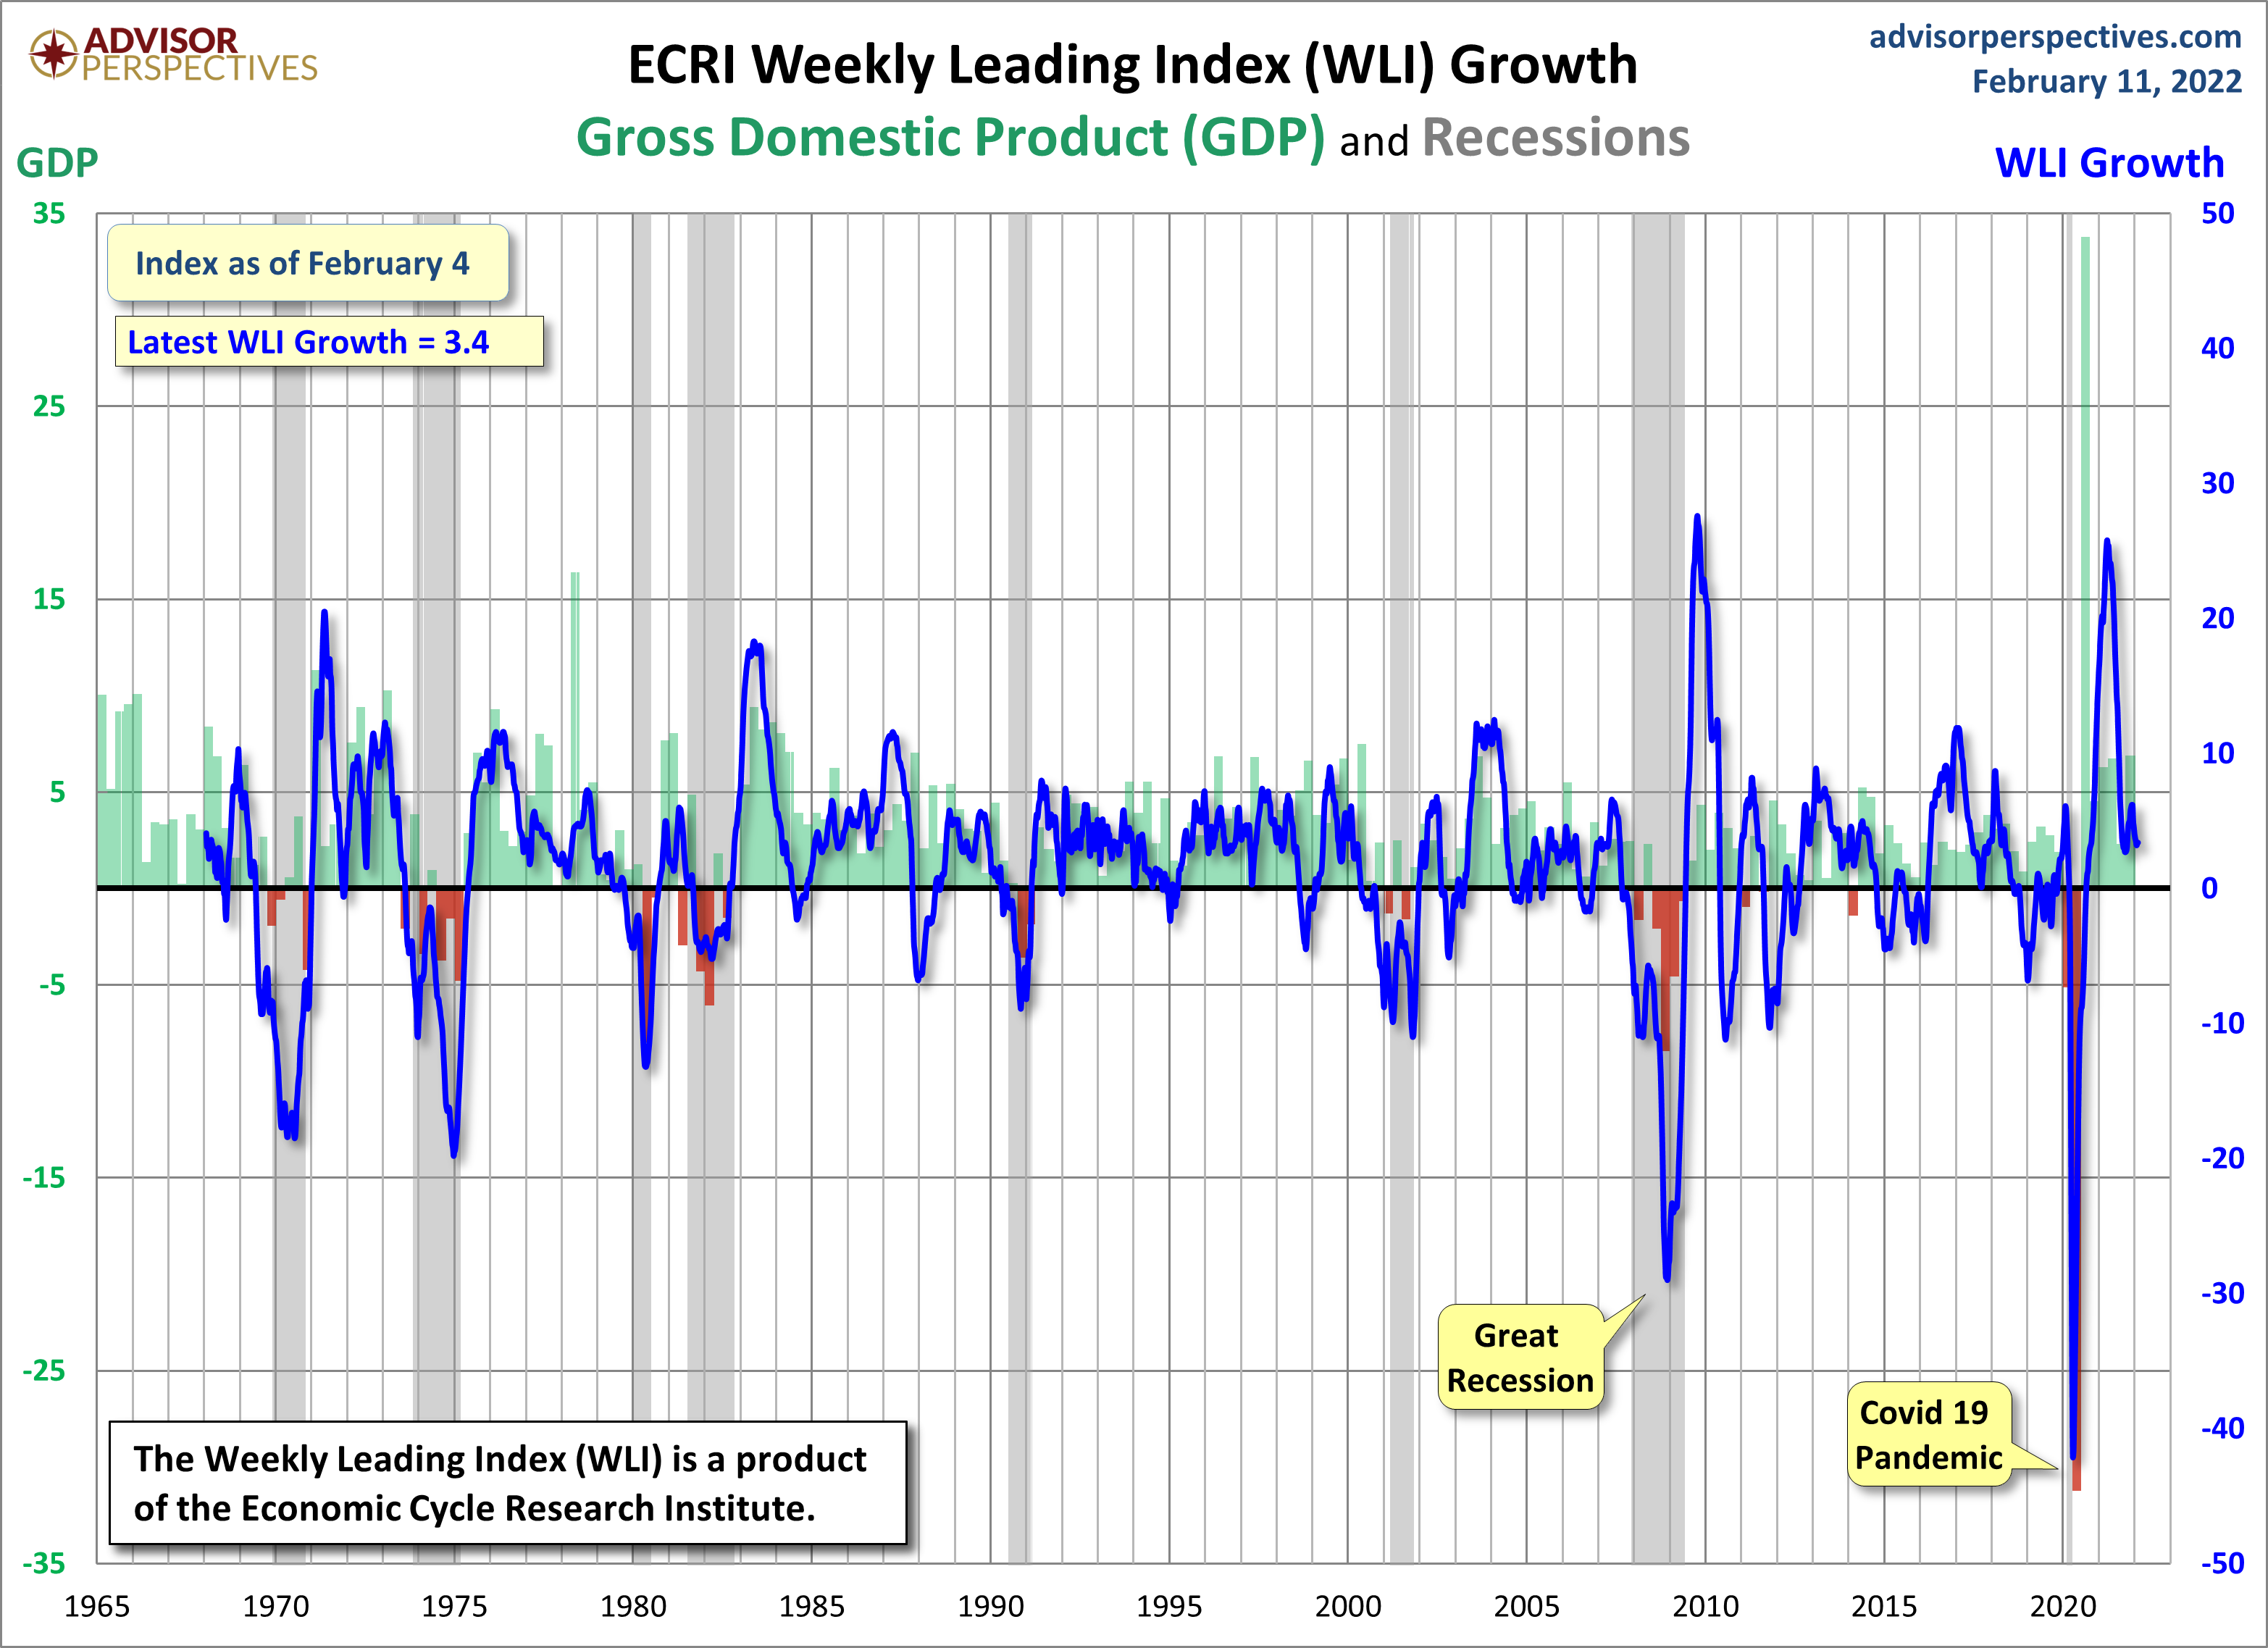
This last chart depicts, on a long-term basis, the WLI, Gr.:
_________
I post various economic indicators and indices because I believe they should be carefully monitored. However, as those familiar with this site are aware, I do not necessarily agree with what they depict or imply.
_____
The Special Note summarizes my overall thoughts about our economic situation
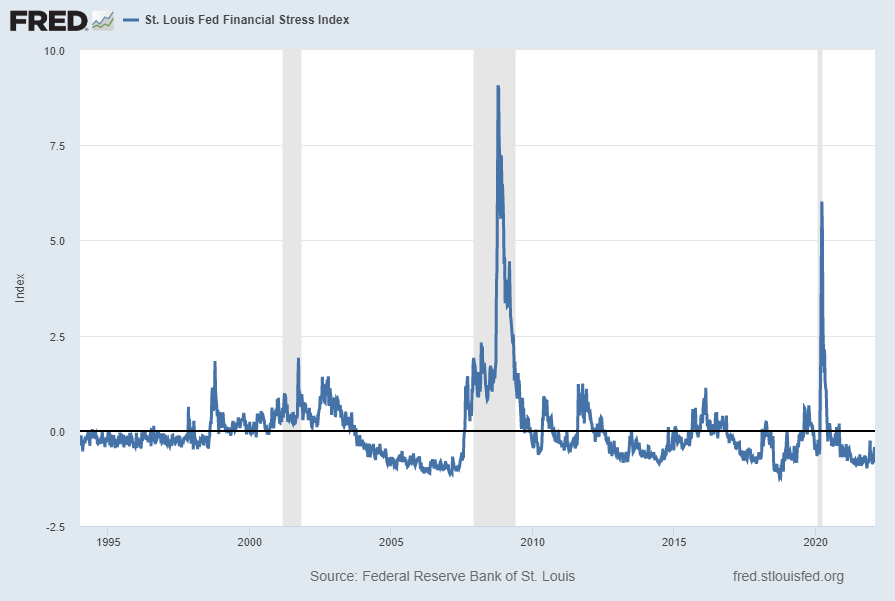
The St. Louis Fed’s Financial Stress Index (STLFSI3) is one index that is supposed to measure stress in the financial system. Its reading as of the February 10, 2022 update (reflecting data through February 4, 2022) is -.7650:
source: Federal Reserve Bank of St. Louis, St. Louis Fed Financial Stress Index [STLFSI3], retrieved from FRED, Federal Reserve Bank of St. Louis; accessed February 10, 2022: https://fred.stlouisfed.org/series/STLFSI3
Of course, there are a variety of other measures and indices that are supposed to measure financial stress and other related issues, both from the Federal Reserve as well as from private sources.
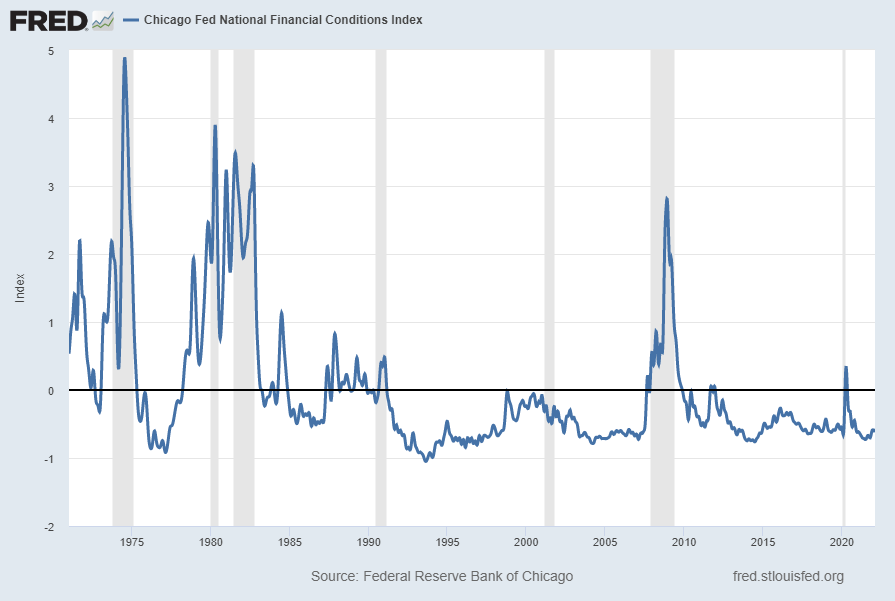
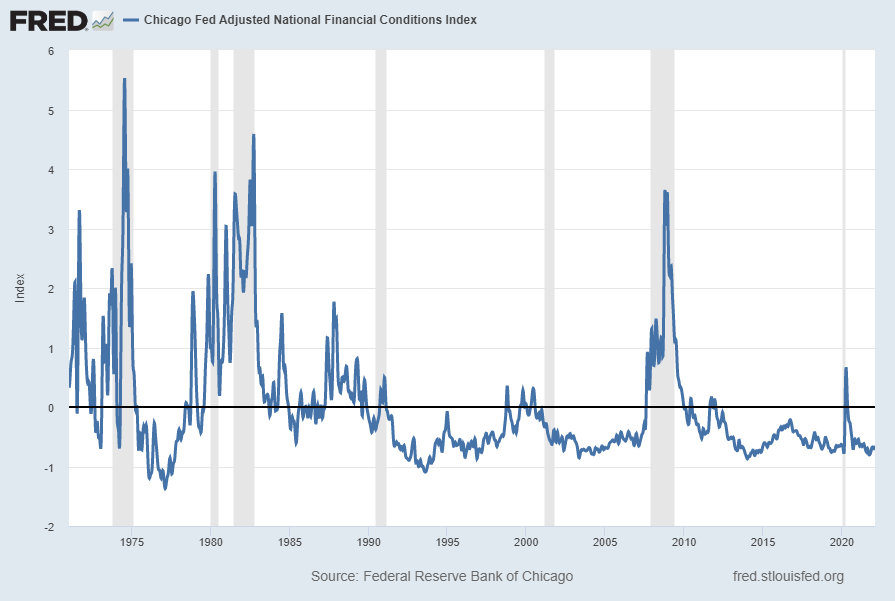
Two other indices that I regularly monitor include the Chicago Fed National Financial Conditions Index (NFCI) as well as the Chicago Fed Adjusted National Financial Conditions Index (ANFCI).
Here are summary descriptions of each, as seen in FRED:
The National Financial Conditions Index (NFCI) measures risk, liquidity and leverage in money markets and debt and equity markets as well as in the traditional and “shadow” banking systems. Positive values of the NFCI indicate financial conditions that are tighter than average, while negative values indicate financial conditions that are looser than average.
The adjusted NFCI (ANFCI). This index isolates a component of financial conditions uncorrelated with economic conditions to provide an update on how financial conditions compare with current economic conditions.
For further information, please visit the Federal Reserve Bank of Chicago’s web site:
Below are the most recently updated charts of the NFCI and ANFCI, respectively.
The NFCI chart below was last updated on February 9, 2022 incorporating data from January 8, 1971 through February 4, 2022 on a weekly basis. The February 4 value is -.57192:
The ANFCI chart below was last updated on February 9, 2022 incorporating data from January 8, 1971 through February 4, 2022, on a weekly basis. The February 4, 2022 value is -.65159:
I post various indicators and indices because I believe they should be carefully monitored. However, as those familiar with this site are aware, I do not necessarily agree with what they depict or imply.
_____
The Special Note summarizes my overall thoughts about our economic situation
Throughout this site there are many discussions of economic indicators. This post is the latest in a series of posts indicating facets of U.S. economic weakness or a notably low growth rate.
The level and trend of economic growth is especially notable at this time. As seen in various measures and near-term projections, the U.S. economy had undergone an outsized level of economic contraction in 2020. However, most people believe (and virtually all prominent economic forecasts indicate) that this historic level of contraction will have proven ephemeral in nature; i.e. an economic expansion will continue.
Below are a small sampling of charts that depict weak growth or contraction, and a brief comment for each:
__
Advance Retail Sales: Retail Trade and Food Services (RSAFS)
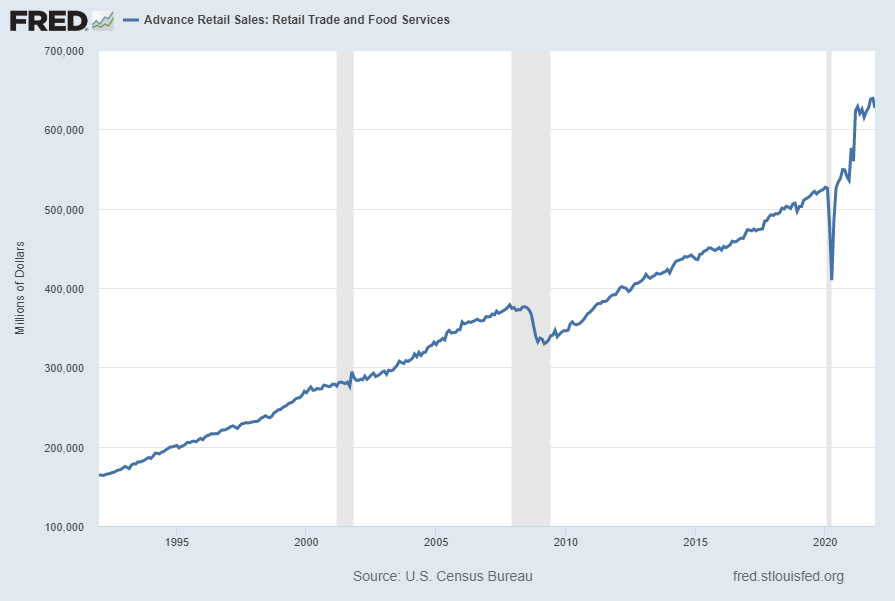
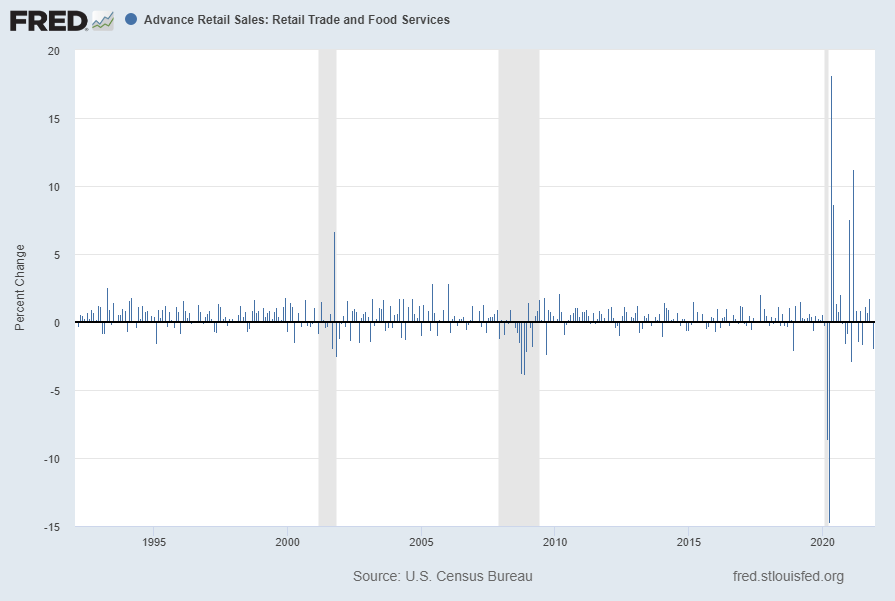
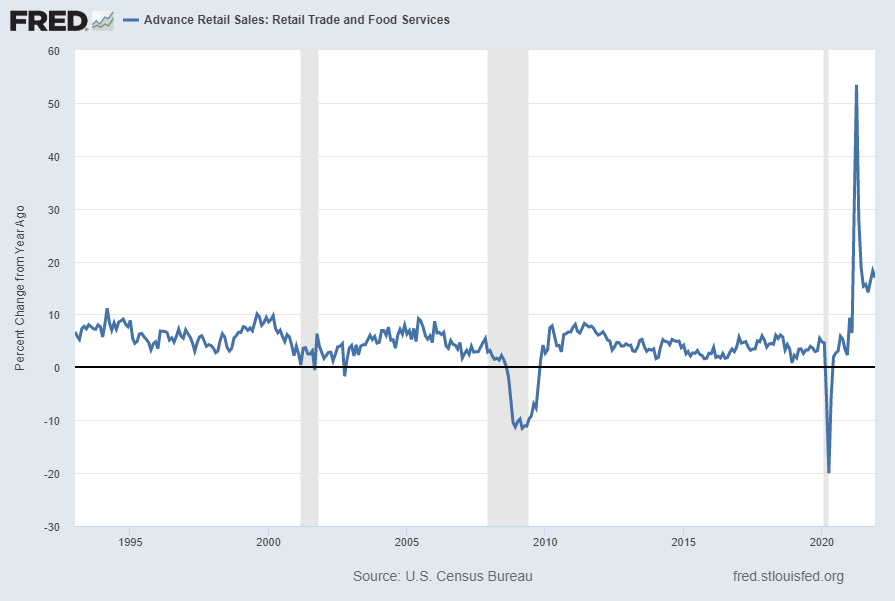
Advance Retail Sales: Retail Trade and Food Services (RSAFS), when viewed from a long-term perspective, has recently been volatile. While the trend when viewed from a “Percent Change From Year Ago” basis remains – as one might expect – robust, when viewed from a “Percent Change” (from the prior month) basis the growth trend appears less robust.
Shown below is this measure with last value of $626,833 Million through December, last updated January 14, 2022:
Displayed below is this same RSAFS measure on a “Percent Change” (from prior month) basis with value -1.9%:
Below is this measure displayed on a “Percent Change From Year Ago” basis with value 16.9%:
source: U.S. Census Bureau, Advance Retail Sales: Retail and Food Services, Total [RSAFS], retrieved from FRED, Federal Reserve Bank of St. Louis; accessed February 9, 2022: https://fred.stlouisfed.org/series/RSAFS
__
Commercial And Industrial Loans, All Commercial Banks (BUSLOANS)
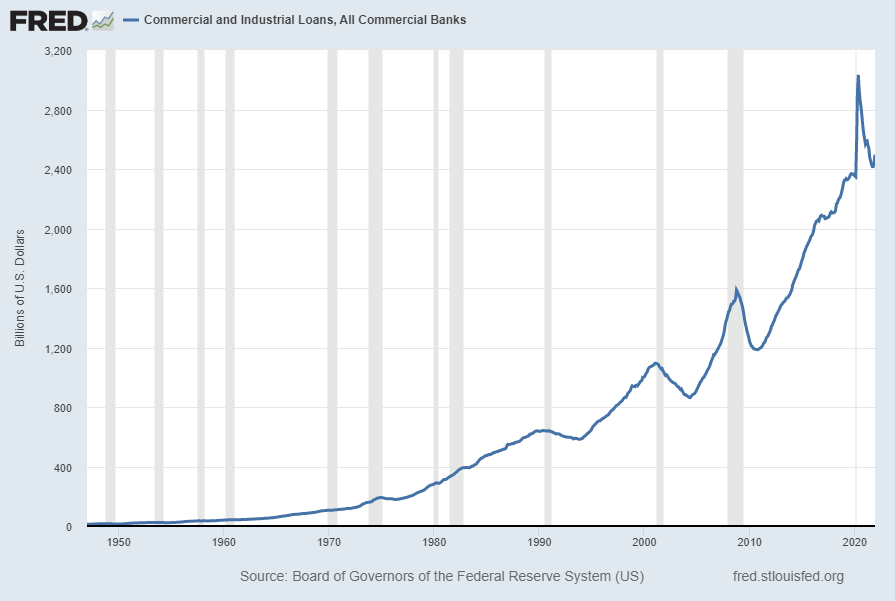
“Commercial And Industrial Loans, All Commercial Banks” (BUSLOANS) has recently been volatile. Shown below is this measure with last value of $2,495.7226 Billion through December 2021, last updated February 4, 2022:
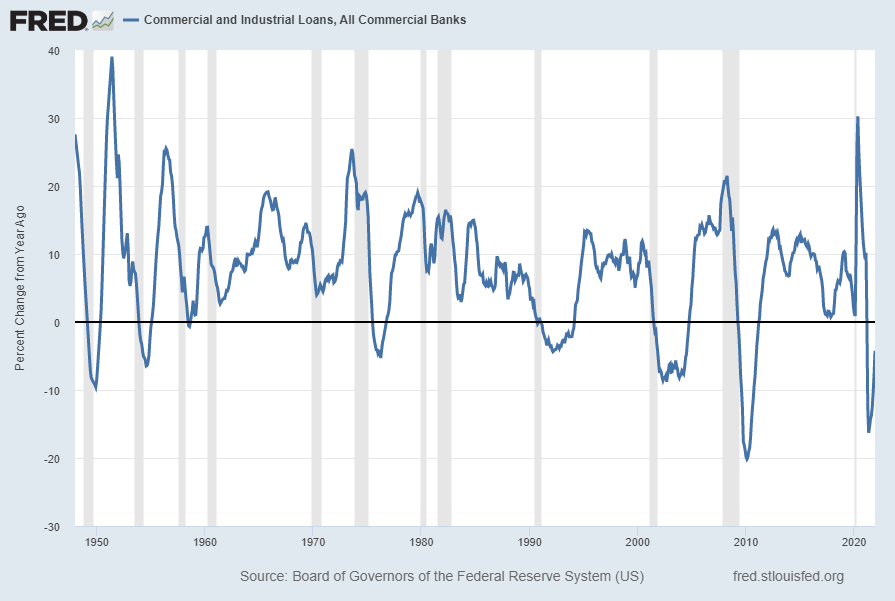
Below is this measure displayed on a “Percent Change From Year Ago” basis with value -4.2%:
source: Board of Governors of the Federal Reserve System (US), Commercial and Industrial Loans, All Commercial Banks [BUSLOANS], retrieved from FRED, Federal Reserve Bank of St. Louis; accessed February 9, 2022: https://fred.stlouisfed.org/series/BUSLOANS
__
The Yield Curve
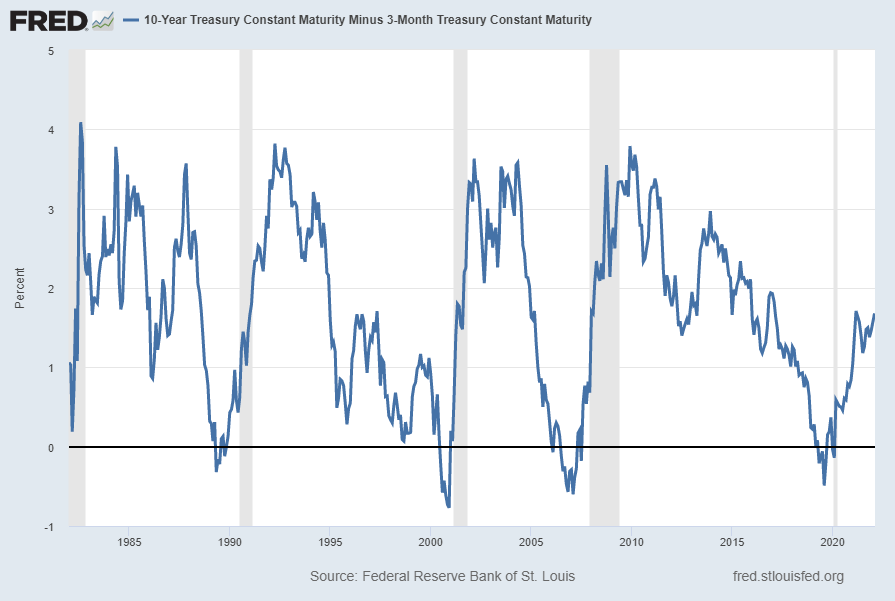
Many people believe that the Yield Curve is a leading economic indicator for the United States economy.
While I continue to have the stated reservations regarding the “Yield Curve” as an indicator, I do believe that it should be monitored.
The U.S. Yield Curve (one proxy seen below) while positive, is (all things considered) relatively low when viewed from a long-term perspective. Below is the spread between the 10-Year Treasury Constant Maturity and the 3-Month Treasury Constant Maturity from 1982 through the February 9, 2022 value, showing a value of 1.68% [10-Year Treasury Yield (FRED DGS10) of 1.96% as of February 8, 3-Month Treasury Yield (FRED DGS3MO) of .25% as of February 8]:
source: Federal Reserve Bank of St. Louis, 10-Year Treasury Constant Maturity Minus 3-Month Treasury Constant Maturity [T10Y3M], retrieved from FRED, Federal Reserve Bank of St. Louis; accessed February 9, 2022: https://fred.stlouisfed.org/series/T10Y3M
__
Industrial Production: Consumer Goods (IPCONGD)
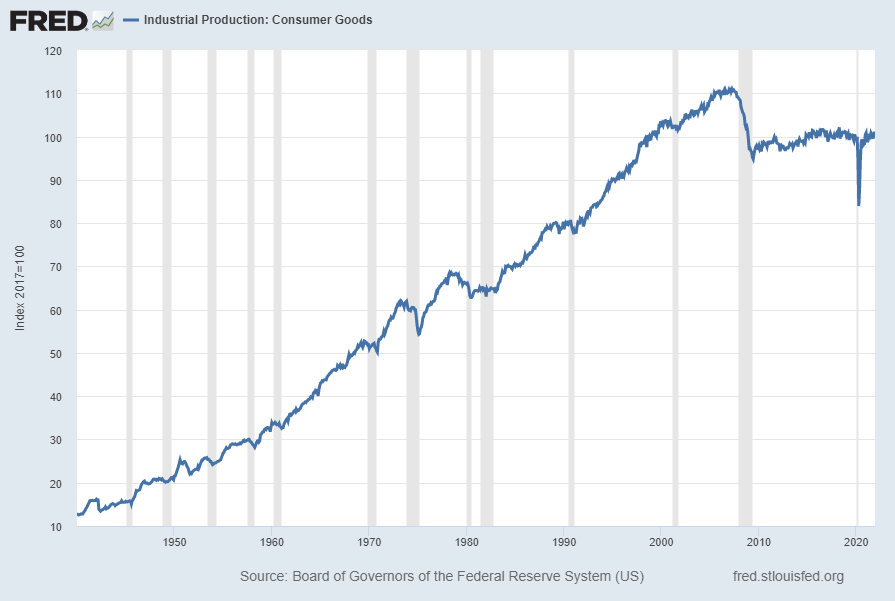
The “Industrial Production: Consumer Goods” measure has been relatively subdued since the Financial Crisis. Shown below is a long-term chart of this measure (displayed from 1939), with last value of 100.1636 through December 2021, last updated January 14, 2022:
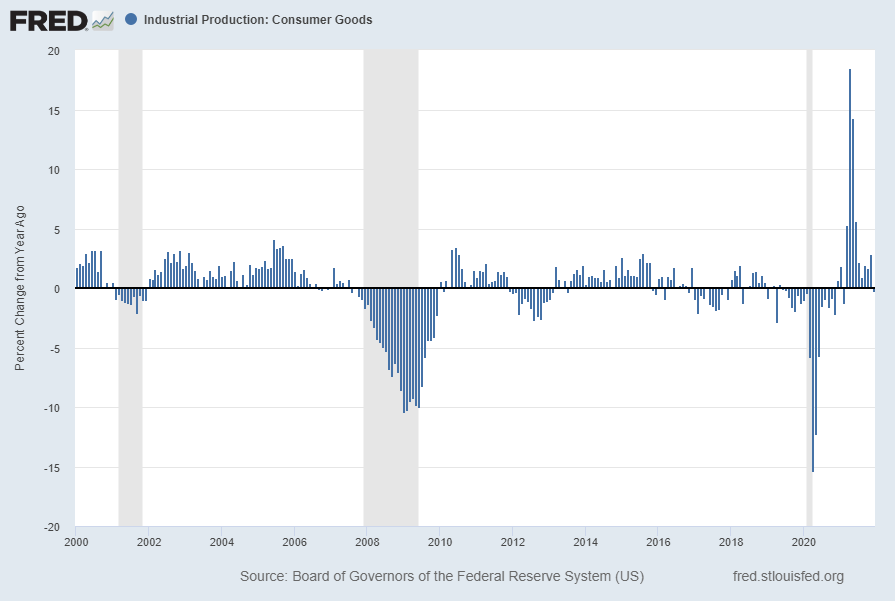
Displayed below is this same IPCONGD measure on a “Percent Change From Year Ago” basis. The current value is -.2%:
source: Board of Governors of the Federal Reserve System (US), Industrial Production: Consumer Goods [IPCONGD], retrieved from FRED, Federal Reserve Bank of St. Louis; accessed February 9, 2022: https://fred.stlouisfed.org/series/IPCONGD
__
Other Indicators
As mentioned previously, many other indicators discussed on this site indicate slow economic growth or economic contraction, if not outright (gravely) problematical economic conditions.
_____
The Special Note summarizes my overall thoughts about our economic situation
One of the foremost economic issues facing the United States, as well as other countries, is whether the current outsized level of inflation will subside. In other words, is the current high level of inflation transitory?
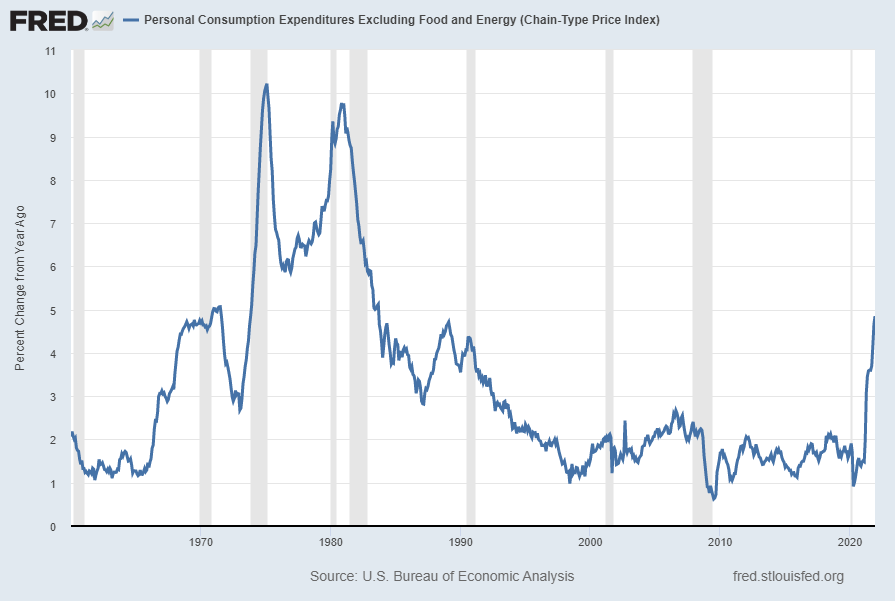
For reference, here is a long-term chart of the Core Personal Consumption Expenditures Index, which is often said to be the Federal Reserve’s “preferred” inflation measure. The current reading, as of the January 28, 2022 update, is 4.9%:
source: U.S. Bureau of Economic Analysis, Personal Consumption Expenditures Excluding Food and Energy (Chain-Type Price Index) [PCEPILFE], retrieved from FRED, Federal Reserve Bank of St. Louis; accessed February 7, 2022: https://fred.stlouisfed.org/series/PCEPILFE
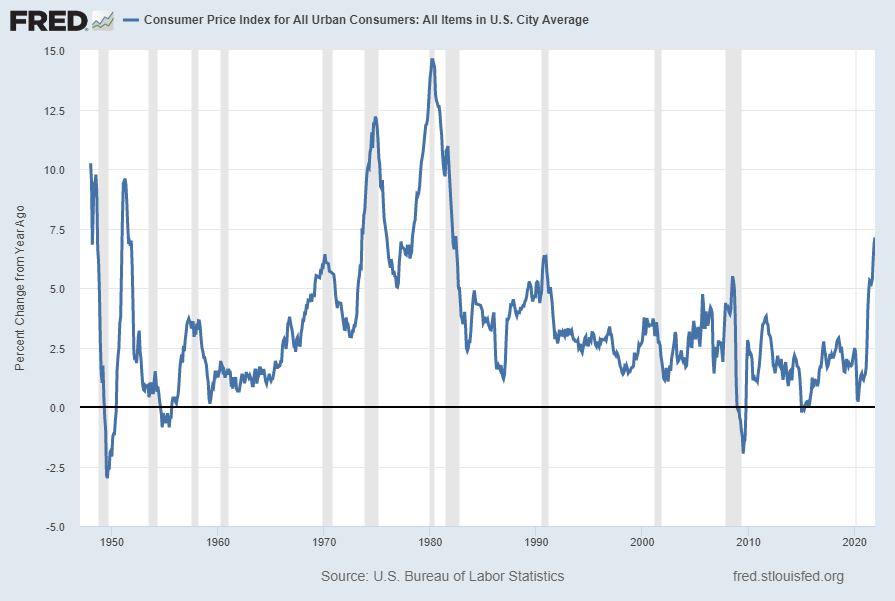
Below is a chart of CPI inflation. The reading for the December 2021 report, released January 12, 2022, is 7.1%:
source: U.S. Bureau of Labor Statistics, Consumer Price Index for All Urban Consumers: All Items in U.S. City Average [CPIAUCSL], retrieved from FRED, Federal Reserve Bank of St. Louis; accessed February 7, 2022: https://fred.stlouisfed.org/series/CPIAUCSL
Of course, price stability (i.e. lack of significant inflation) is one of two main stated goals of the Federal Reserve, as seen in the Federal Reserve’s Dual Mandate.
Below are various reasons that have been cited in support of the belief that the current high level of inflation will be transitory, i.e. it will subside over the next few months at which point it will stabilize. Please note that the commentary below is purely for reference…i.e. I do not necessarily share in the belief that inflation will be transitory, nor do I necessarily believe any of the reasons offered below.
Overall, the most-commonly stated reason for the current upswing in inflation stems from the belief that due to COVID-19, production has been constrained, and other supply chain issues have also arisen, such as delivery bottlenecks. As stated by Federal Reserve Chair Jerome Powell, during the January 26, 2022 FOMC Press Conference:
Inflation remains well above our longer-run goal of 2 percent. Supply and demand imbalances related to the pandemic and the reopening of the economy have continued to contribute to elevated levels of inflation. In particular, bottlenecks and supply constraints are limiting how quickly production can respond to higher demand in the near term. These problems have been larger and longer lasting than anticipated, exacerbated by waves of the virus.
While the drivers of higher inflation have been predominantly connected to the dislocations caused by the pandemic, price increases have now spread to a broader range of goods and services. Wages have also risen briskly, and we are attentive to the risks that persistent real wage growth in excess of productivity could put upward pressure on inflation. Like most forecasters, we continue to expect inflation to decline over the course of the year.
As mentioned above, the consensus among professional forecasters is that by the end of 2022 inflation will have significantly subsided. For example, as seen in the January 2022 Wall Street Journal Economic Forecast Survey, the average survey response for December 2022 is that CPI will be 3.11% and the Core PCE will be 3.0%. Year-end 2023 forecasts shows further diminishment.
Various surveys of both consumers and businesses indicate inflation expectations. For instance, the Federal Reserve Bank of Atlanta publishes a “Business Inflation Expectations” (BIE) survey. Its latest reading, as of the January 12, 2022 report, shows year-ahead inflation expectations among businesses surveyed to average 3.4%.
As for consumer expectations, the Federal Reserve Bank of New York published the December 2021 Survey of Consumer Expectations on January 10, 2022. In seen in this survey “Median one-year and three-year-ahead inflation expectations both remained unchanged in December at 6.0% and 4.0%, respectively.”
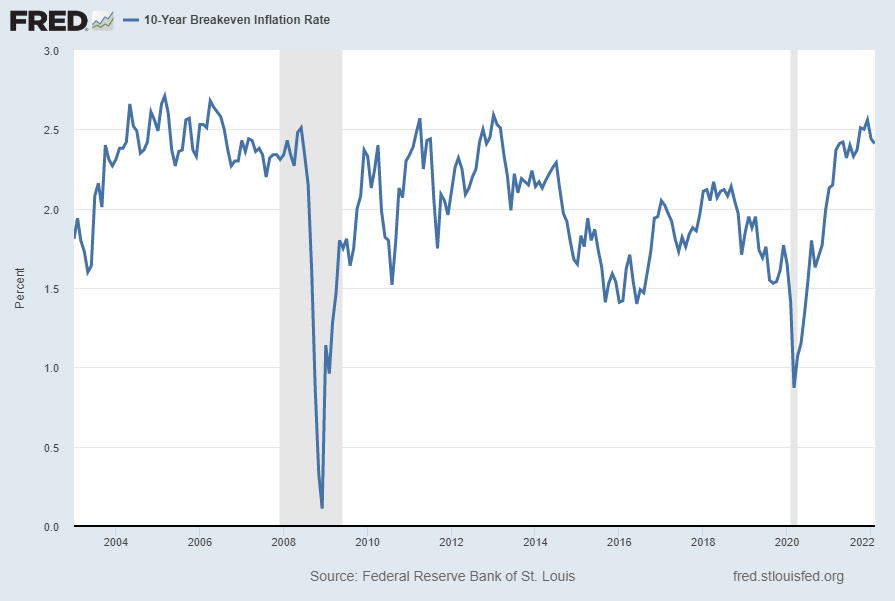
Various market-based measures indicate future inflation below 3 percent. Below is a chart of the 10-Year Breakeven Inflation Rate, at 2.41% as of February 4, 2022. This rate is defined in FRED as: “The latest value implies what market participants expect inflation to be in the next 10 years, on average.”
source: Federal Reserve Bank of St. Louis, 10-Year Breakeven Inflation Rate [T10YIE], retrieved from FRED, Federal Reserve Bank of St. Louis; accessed February 6, 2022: https://fred.stlouisfed.org/series/T10YIE
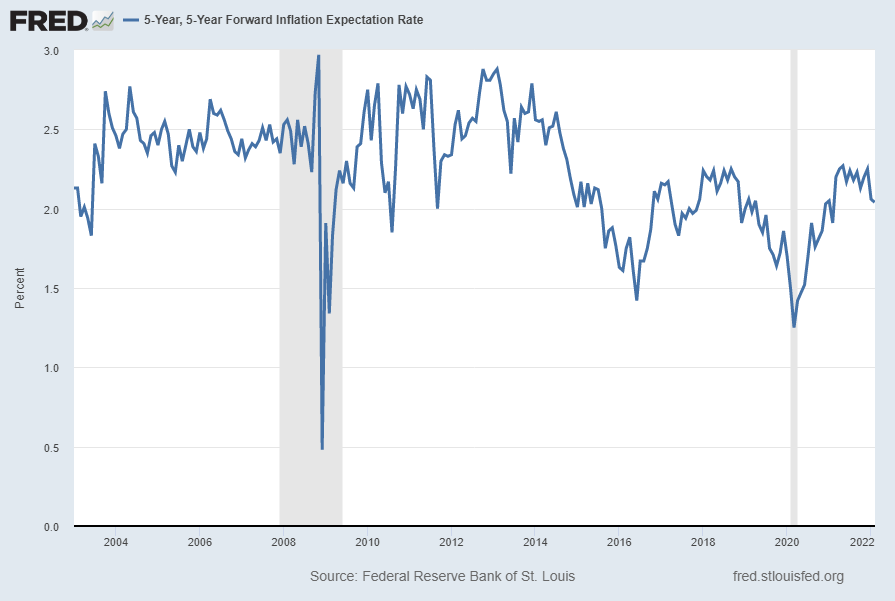
Another market-based inflation indicator is the 5-Year, 5-Year Forward Inflation Expectation Rate, at 2.04% as of February 4, 2022. This rate is defined in FRED as: “This series is a measure of expected inflation (on average) over the five-year period that begins five years from today.” A long-term chart is seen below:
source: Federal Reserve Bank of St. Louis, 5-Year, 5-Year Forward Inflation Expectation Rate [T5YIFR], retrieved from FRED, Federal Reserve Bank of St. Louis; accessed February 6, 2022: https://fred.stlouisfed.org/series/T5YIFR
_____
The Special Note summarizes my overall thoughts about our economic situation
There are a variety of economic models that are supposed to predict the probabilities of recession.
While I don’t agree with the methodologies employed or probabilities of impending economic weakness as depicted by the following two models, I think the results of these models should be monitored.
Please note that each of these models is updated regularly, and the results of these – as well as other recession models – can fluctuate significantly.
Currently (last updated February 4, 2022 using data through January 2022) this “Yield Curve” model shows a 6.0442% probability of a recession in the United States twelve months ahead. For comparison purposes, it showed a 7.7036% probability through December 2021, and a chart going back to 1960 is seen at the “Probability Of U.S. Recession Predicted by Treasury Spread.” (pdf)
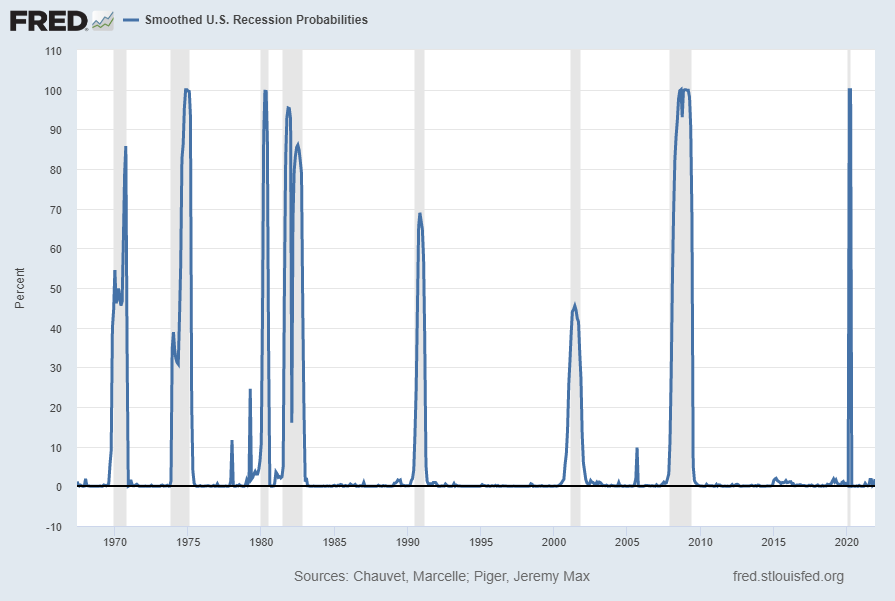
Smoothed recession probabilities for the United States are obtained from a dynamic-factor markov-switching model applied to four monthly coincident variables: non-farm payroll employment, the index of industrial production, real personal income excluding transfer payments, and real manufacturing and trade sales. This model was originally developed in Chauvet, M., “An Economic Characterization of Business Cycle Dynamics with Factor Structure and Regime Switching,” International Economic Review, 1998, 39, 969-996. (http://faculty.ucr.edu/~chauvet/ier.pdf)
This model, last updated on February 1, 2022 currently shows a 1.82% probability using data through December 2021.
Here is the FRED chart (last updated February 1, 2022):
Data Source: Piger, Jeremy Max and Chauvet, Marcelle, Smoothed U.S. Recession Probabilities [RECPROUSM156N], retrieved from FRED, Federal Reserve Bank of St. Louis, accessed February 7, 2022: http://research.stlouisfed.org/fred2/series/RECPROUSM156N
–
The two models featured above can be compared against measures seen in recent posts. For instance, as seen in the January 16, 2022 post titled “The January 2022 Wall Street Journal Economic Forecast Survey“ economists surveyed averaged a 17.74% probability of a U.S. recession within the next 12 months.
_____
The Special Note summarizes my overall thoughts about our economic situation
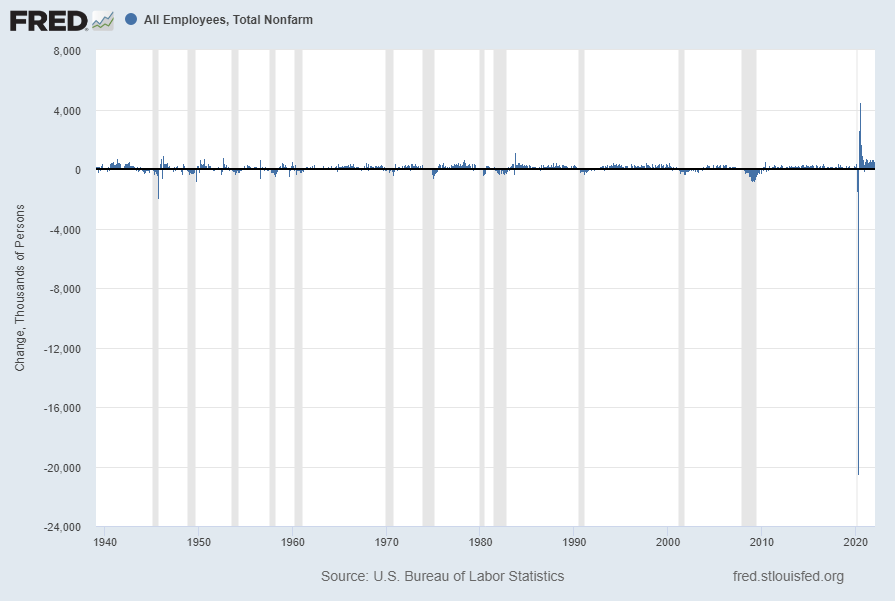
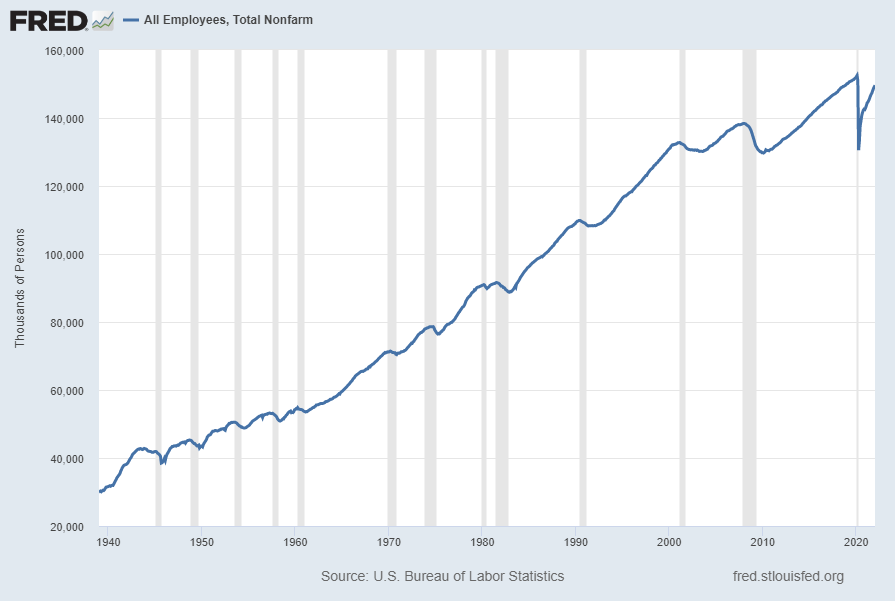
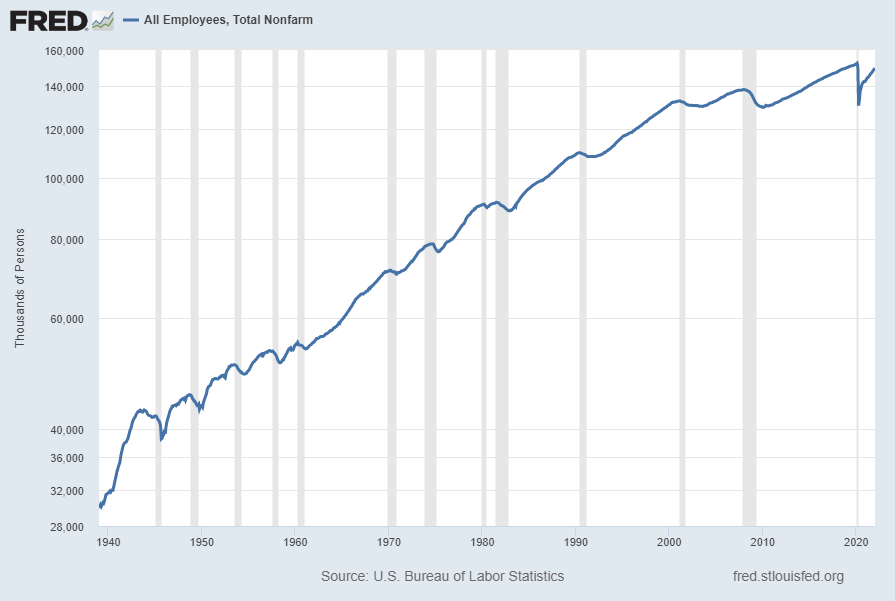
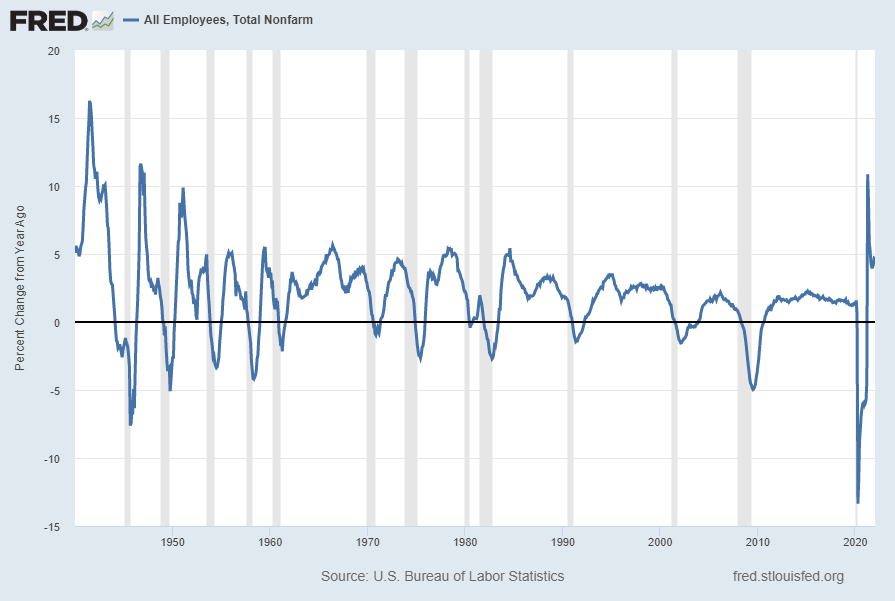
For reference purposes, below are five charts that display growth in payroll employment, as depicted by the Total Nonfarm Payroll measures (FRED data series PAYEMS).
PAYEMS, which is seasonally adjusted, is defined in Financial Reserve Economic Data [FRED] as:
All Employees: Total Nonfarm, commonly known as Total Nonfarm Payroll, is a measure of the number of U.S. workers in the economy that excludes proprietors, private household employees, unpaid volunteers, farm employees, and the unincorporated self-employed. This measure accounts for approximately 80 percent of the workers who contribute to Gross Domestic Product (GDP).
This measure provides useful insights into the current economic situation because it can represent the number of jobs added or lost in an economy. Increases in employment might indicate that businesses are hiring which might also suggest that businesses are growing. Additionally, those who are newly employed have increased their personal incomes, which means (all else constant) their disposable incomes have also increased, thus fostering further economic expansion.
Generally, the U.S. labor force and levels of employment and unemployment are subject to fluctuations due to seasonal changes in weather, major holidays, and the opening and closing of schools. The Bureau of Labor Statistics (BLS) adjusts the data to offset the seasonal effects to show non-seasonal changes: for example, women’s participation in the labor force; or a general decline in the number of employees, a possible indication of a downturn in the economy. To closely examine seasonal and non-seasonal changes, the BLS releases two monthly statistical measures: the seasonally adjusted All Employees: Total Nonfarm (PAYEMS) and All Employees: Total Nonfarm (PAYNSA), which is not seasonally adjusted.
The series comes from the ‘Current Employment Statistics (Establishment Survey).’
The source code is: CES0000000001
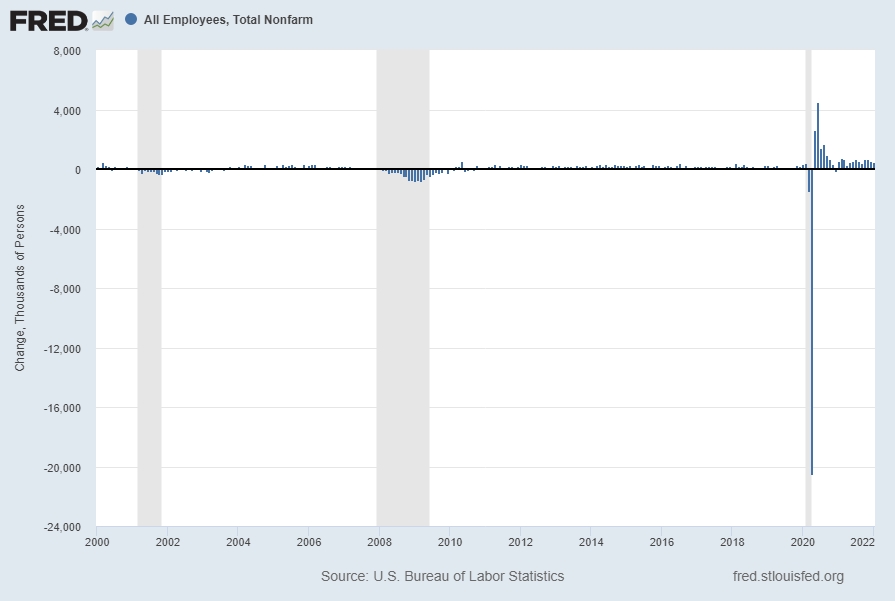
The first chart shows the monthly change in Total Nonfarm Payroll from the year 2000 through the current January 2022 report (January 2022 value of 467 (Thousands)):
(click on charts to enlarge images)
Data Source: FRED, Federal Reserve Economic Data, Federal Reserve Bank of St. Louis: All Employees: Total Nonfarm [PAYEMS] ; U.S. Department of Labor: Bureau of Labor Statistics; accessed February 4, 2022; https://fred.stlouisfed.org/series/PAYEMS
The second chart shows a longer-term chart of the same month-over-month change in Total Nonfarm Payroll (reports of February 1939 through the present report of January 2022):
The third chart shows the aggregate number of Total Nonfarm Payroll, from the reports of January 1939 – January 2022 (January 2022 value of 149.629 million):
The fourth chart shows this same measure of aggregate number of Total Nonfarm Payroll as seen above but presented on a LOG scale:
Lastly, the fifth chart shows the Total Nonfarm Payroll number on a “Percent Change from Year Ago” basis from January 1940 – January 2022: (January 2022 value of 4.6%)
_________
I post various indicators and indices because I believe they should be carefully monitored. However, as those familiar with this site are aware, I do not necessarily agree with what they depict or imply.
_____
The Special Note summarizes my overall thoughts about our economic situation