This page discusses the current high level of U.S. inflation, factors that influence the level of inflation, and the possibility of hyperinflation occurring. The effects that a hyperinflation and accompanying substantial drop in the U.S. Dollar would have on the American economic future is of paramount importance.
_____
The Special Note summarizes my overall thoughts about our economic situation
A few days ago (February 8, 2022) I wrote a post titled “The Belief That Current Inflation Levels Will Subside.”That post discussed various reasons that support the belief that the current high level of inflation will be transitory, i.e. inflation will subside over the next few months at which point it will then stabilize. This belief is the consensus among economists and other professional forecasters, and is seen in forecasts from the Federal Reserve.
However, there are many reasons to believe that inflation will increase from these levels, perhaps substantially. Of course, should this increase occur, it would create an array of problems. Due to the perniciousness of inflation – especially high levels of inflation – “price stability” has been one of two long-stated main goals of the Federal Reserve as seen in the Federal Reserve’s “Dual Mandate.”
Perhaps the main reason to believe that inflation will increase from these levels is that increases so far have been largely unforeseen, and that such increases have been of an outsized magnitude. As well, as further discussed below, there are many highly notable aspects of the current U.S. economic and financial situation which can (substantially) worsen inflation.
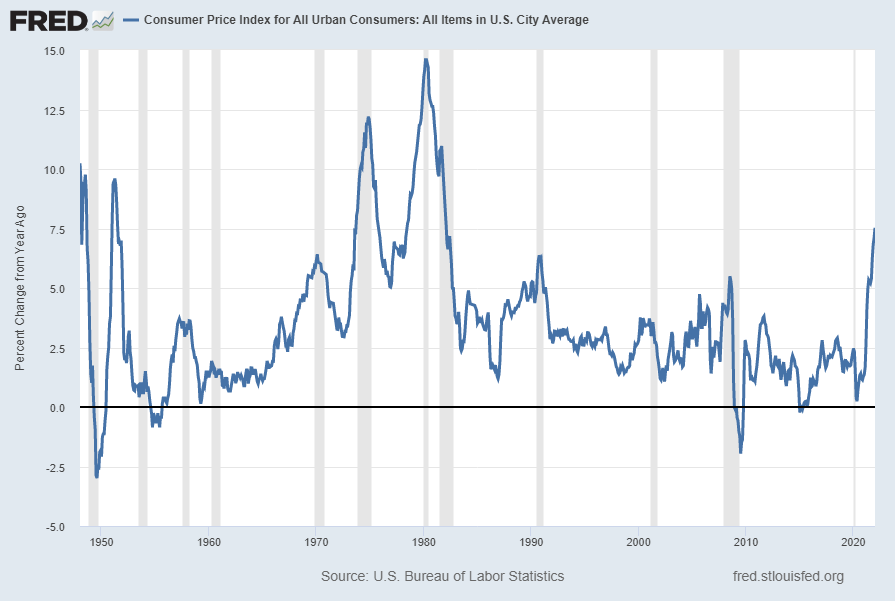
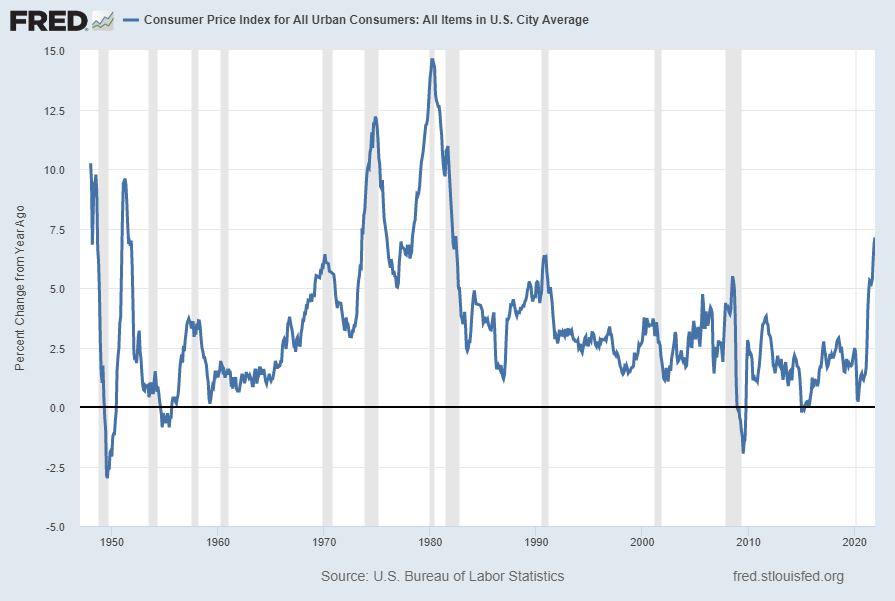
For reference, here are some charts of the most commonly cited U.S. inflation measure, headline CPI, at 7.5% as of the latest update of February 10, 2022 (from the January 2022 CPI report):
source: U.S. Bureau of Labor Statistics, Consumer Price Index for All Urban Consumers: All Items in U.S. City Average [CPIAUCSL], retrieved from FRED, Federal Reserve Bank of St. Louis; accessed February 7, 2022: https://fred.stlouisfed.org/series/CPIAUCSL
As seen in the chart above, the level of CPI is at decade-high levels. The last time such a level was seen was in the early-80’s, which (of course) was considered a highly inflationary era. Of note, not only is inflation currently at a historically high level, but the inflation is very broad-based.
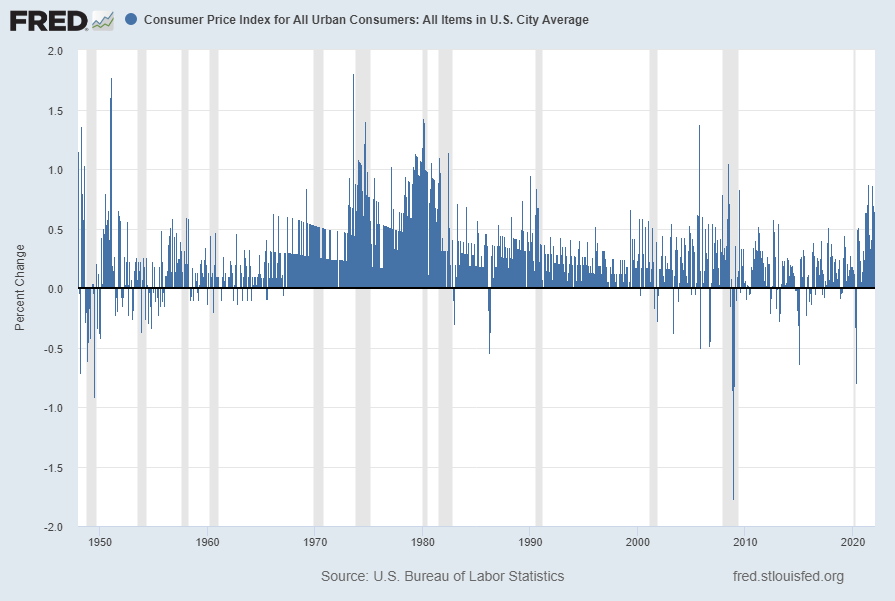
Here is this same CPI measure on a “Percent Change” (from prior month) basis, showing a January 2022 value of .6 Percent:
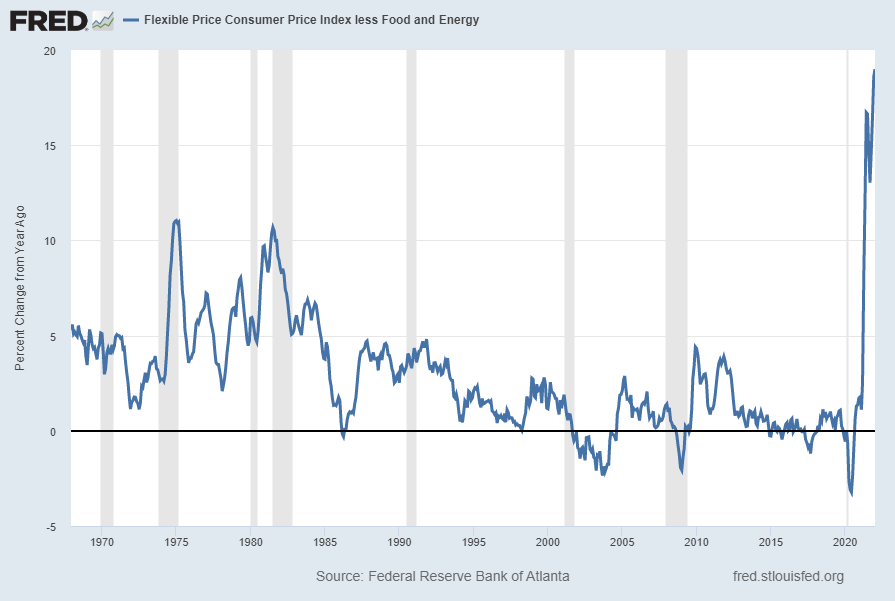
Another measure that depicts an outsized level of inflation is the Federal Reserve Bank of Atlanta’s Core Flexible Price Consumer Price Index. As of the February 10, 2022 update the reading is at 18.99% as seen in the chart below:
source: Federal Reserve Bank of Atlanta, Flexible Price Consumer Price Index less Food and Energy [COREFLEXCPIM159SFRBATL], retrieved from FRED, Federal Reserve Bank of St. Louis; accessed February 14, 2022: https://fred.stlouisfed.org/series/COREFLEXCPIM159SFRBATL
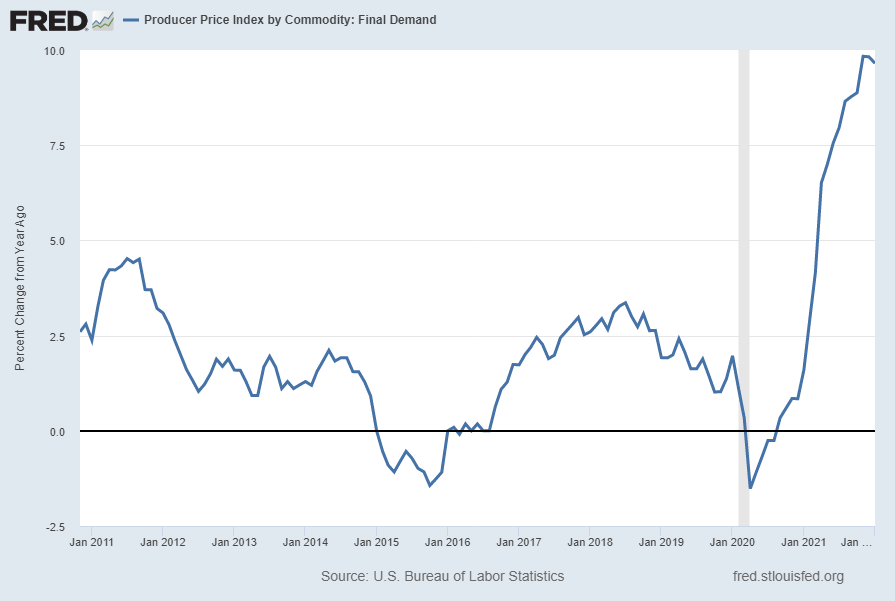
From the Producer Price Index report of January 2022, released February 15, 2022, here is the Producer Price Index by Commodity: Final Demand [PPIFID] currently showing a 9.7% Change From Year Ago:
source: U.S. Bureau of Labor Statistics, Producer Price Index by Commodity: Final Demand [PPIFID], retrieved from FRED, Federal Reserve Bank of St. Louis; accessed February 15, 2022: https://fred.stlouisfed.org/series/PPIFID
Of note, various early-stage input prices, including many commodity prices, continue to sharply increase.
Another issue is whether various supply-chain issues are ameliorating with time. While various indexes and metrics have recently been introduced to measure supply-chain disruptions, from an all-things-considered basis it does not (yet) appear as if such issues are substantially diminishing.
A paramount concern with regard to inflation is whether the Federal Reserve is adequately addressing it. In the past, most notably in the (late) 70’s – early 80’s era, the Federal Reserve raised rates sharply in an effort to diminish inflation.
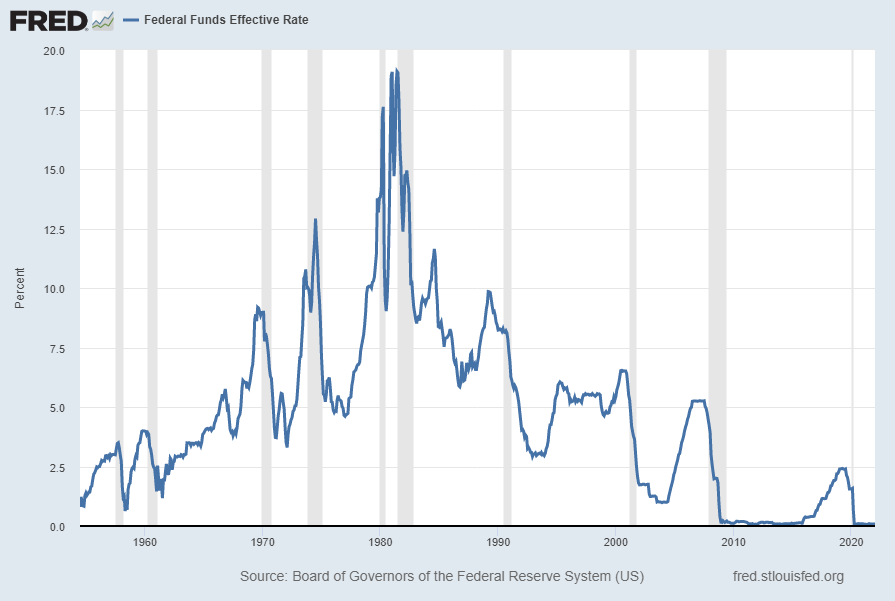
In this current situation, the foremost question is whether the Fed is “behind the curve” with regard to the purported primary inflation remedy, that of raising interest rates. The Fed Funds Effective Rate as seen in the chart below remains at a negligible level (.08% as of the February 1, 2022 update):
source: Board of Governors of the Federal Reserve System (US), Federal Funds Effective Rate [FEDFUNDS], retrieved from FRED, Federal Reserve Bank of St. Louis; accessed February 14, 2022: https://fred.stlouisfed.org/series/FEDFUNDS
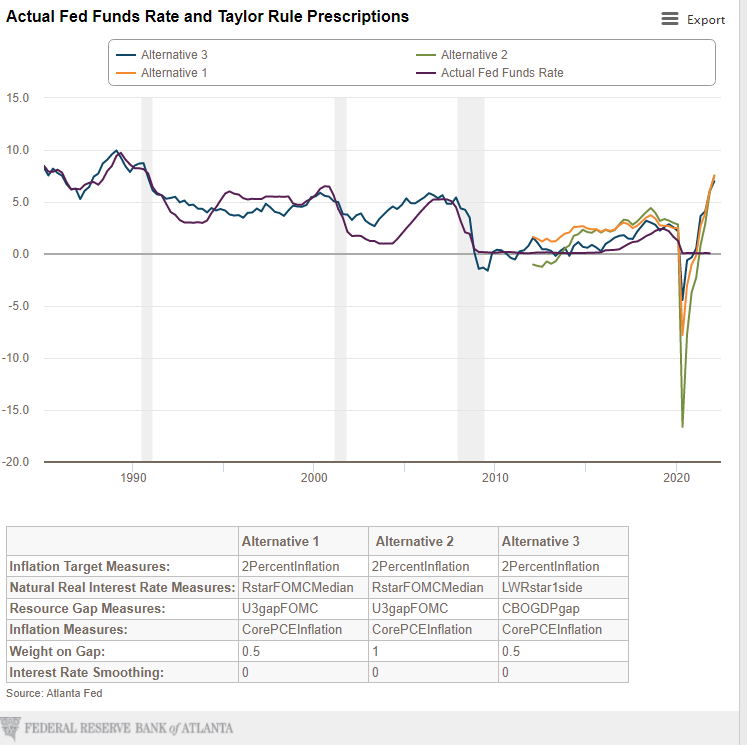
There are various indicators that can be used to gauge whether the current level of the Fed Funds Rate is appropriate. One such prominent measure is the Taylor Rule and the resulting Taylor Rule Prescription. Of note, the Taylor Rule Prescription can vary substantially depending upon which parameters are specified.
As seen on the Federal Reserve Bank of Atlanta’s site, the Taylor Rule prescription given the assigned factors is seen in the following chart, updated February 10, 2022:
As seen in the above chart, the Taylor Rule Prescription for the three alternatives shown range from 6.98% to 7.55% compared to the actual Fed Funds Rate of .09%.
Other indicators also imply that the Fed Funds Rate should be substantially higher than current levels.
As noted previously, there are many aspects of the current economic and financial situation which may serve to further extend the level and duration of inflation. A proper discussion of these factors and how they could substantially extend inflation would be both lengthy and complex.
One of these aspects is the possibility of a “wage-price spiral” occurring. Given various conditions, including widespread labor shortages in various sectors as well as wage growth that has been increasing, there is reason to believe that a “wage-price spiral” dynamic could occur. Such a dynamic would be (highly) problematical.
Lastly, if high levels of inflation persist – and further increase – there is a possibility of a hyperinflationary environment occurring. A hyperinflation would be exceedingly problematical.
_____
The Special Note summarizes my overall thoughts about our economic situation
One of the foremost economic issues facing the United States, as well as other countries, is whether the current outsized level of inflation will subside. In other words, is the current high level of inflation transitory?
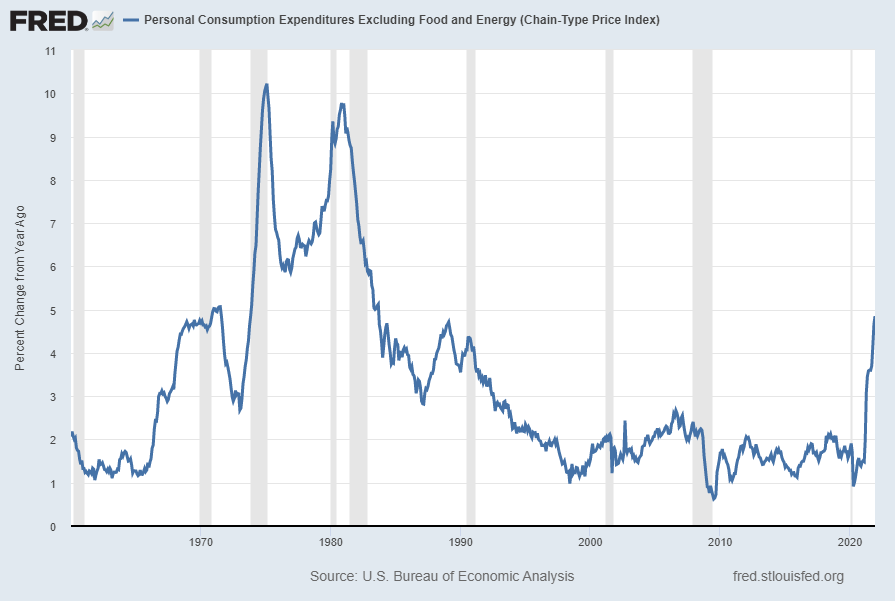
For reference, here is a long-term chart of the Core Personal Consumption Expenditures Index, which is often said to be the Federal Reserve’s “preferred” inflation measure. The current reading, as of the January 28, 2022 update, is 4.9%:
source: U.S. Bureau of Economic Analysis, Personal Consumption Expenditures Excluding Food and Energy (Chain-Type Price Index) [PCEPILFE], retrieved from FRED, Federal Reserve Bank of St. Louis; accessed February 7, 2022: https://fred.stlouisfed.org/series/PCEPILFE
Below is a chart of CPI inflation. The reading for the December 2021 report, released January 12, 2022, is 7.1%:
source: U.S. Bureau of Labor Statistics, Consumer Price Index for All Urban Consumers: All Items in U.S. City Average [CPIAUCSL], retrieved from FRED, Federal Reserve Bank of St. Louis; accessed February 7, 2022: https://fred.stlouisfed.org/series/CPIAUCSL
Of course, price stability (i.e. lack of significant inflation) is one of two main stated goals of the Federal Reserve, as seen in the Federal Reserve’s Dual Mandate.
Below are various reasons that have been cited in support of the belief that the current high level of inflation will be transitory, i.e. it will subside over the next few months at which point it will stabilize. Please note that the commentary below is purely for reference…i.e. I do not necessarily share in the belief that inflation will be transitory, nor do I necessarily believe any of the reasons offered below.
Overall, the most-commonly stated reason for the current upswing in inflation stems from the belief that due to COVID-19, production has been constrained, and other supply chain issues have also arisen, such as delivery bottlenecks. As stated by Federal Reserve Chair Jerome Powell, during the January 26, 2022 FOMC Press Conference:
Inflation remains well above our longer-run goal of 2 percent. Supply and demand imbalances related to the pandemic and the reopening of the economy have continued to contribute to elevated levels of inflation. In particular, bottlenecks and supply constraints are limiting how quickly production can respond to higher demand in the near term. These problems have been larger and longer lasting than anticipated, exacerbated by waves of the virus.
While the drivers of higher inflation have been predominantly connected to the dislocations caused by the pandemic, price increases have now spread to a broader range of goods and services. Wages have also risen briskly, and we are attentive to the risks that persistent real wage growth in excess of productivity could put upward pressure on inflation. Like most forecasters, we continue to expect inflation to decline over the course of the year.
As mentioned above, the consensus among professional forecasters is that by the end of 2022 inflation will have significantly subsided. For example, as seen in the January 2022 Wall Street Journal Economic Forecast Survey, the average survey response for December 2022 is that CPI will be 3.11% and the Core PCE will be 3.0%. Year-end 2023 forecasts shows further diminishment.
Various surveys of both consumers and businesses indicate inflation expectations. For instance, the Federal Reserve Bank of Atlanta publishes a “Business Inflation Expectations” (BIE) survey. Its latest reading, as of the January 12, 2022 report, shows year-ahead inflation expectations among businesses surveyed to average 3.4%.
As for consumer expectations, the Federal Reserve Bank of New York published the December 2021 Survey of Consumer Expectations on January 10, 2022. In seen in this survey “Median one-year and three-year-ahead inflation expectations both remained unchanged in December at 6.0% and 4.0%, respectively.”
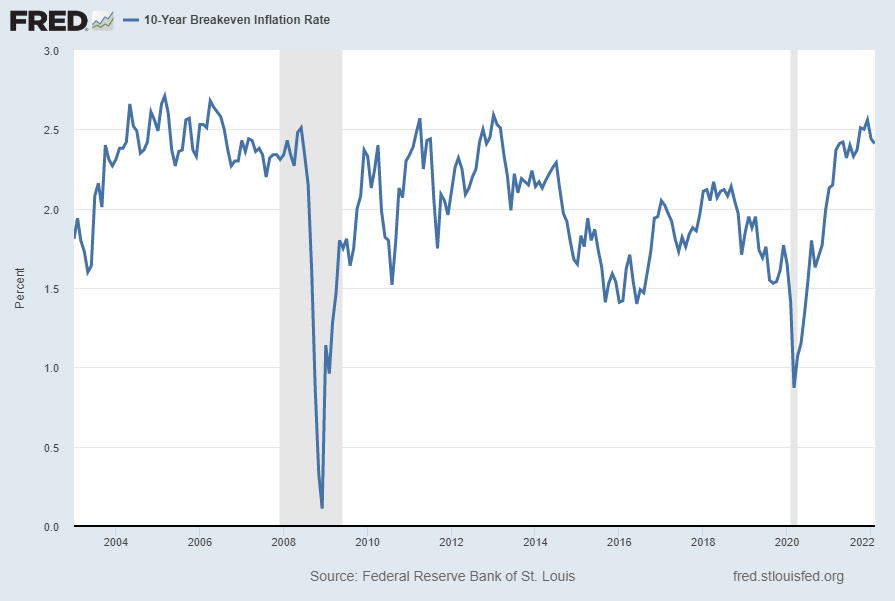
Various market-based measures indicate future inflation below 3 percent. Below is a chart of the 10-Year Breakeven Inflation Rate, at 2.41% as of February 4, 2022. This rate is defined in FRED as: “The latest value implies what market participants expect inflation to be in the next 10 years, on average.”
source: Federal Reserve Bank of St. Louis, 10-Year Breakeven Inflation Rate [T10YIE], retrieved from FRED, Federal Reserve Bank of St. Louis; accessed February 6, 2022: https://fred.stlouisfed.org/series/T10YIE
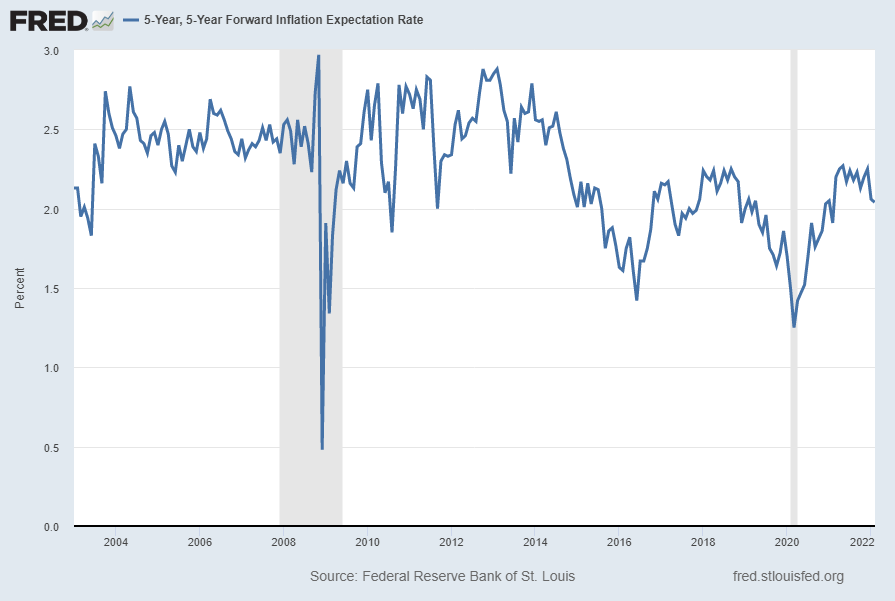
Another market-based inflation indicator is the 5-Year, 5-Year Forward Inflation Expectation Rate, at 2.04% as of February 4, 2022. This rate is defined in FRED as: “This series is a measure of expected inflation (on average) over the five-year period that begins five years from today.” A long-term chart is seen below:
source: Federal Reserve Bank of St. Louis, 5-Year, 5-Year Forward Inflation Expectation Rate [T5YIFR], retrieved from FRED, Federal Reserve Bank of St. Louis; accessed February 6, 2022: https://fred.stlouisfed.org/series/T5YIFR
_____
The Special Note summarizes my overall thoughts about our economic situation
My thought on the matter is that the overall topic of inflation and its effects is a complex one. Adding to the complexity is the definition of inflation. Most people define inflation in terms of CPI, but there are many different ways of defining the concept. On this blog, to avoid confusion, I try to specify what type of inflation measure I am referring to, e.g. "inflation as measured by CPI."
Many people are skeptical of the CPI as a measure of inflation as the figures belie that of practical experience. I'm sure everyone can list innumerable items that have increased in price at a level far above the CPI's increases.
The following chart of historical long-term inflation (as measured by CPI) was seen on Doug Short's blog November 17:
(click on image to enlarge)
-
As one can see, CPI is depicted in red and blue (deflation and inflation respectively). Doug has also superimposed (in gray) an alternate measure of inflation, that of the SGS Alternate CPI. This measure is seen post-1982.
For those unfamiliar with the SGS Alternate CPI (explained here), it is a measure derived by John Williams, as seen on his Shadow Governement Statistics site, shadowstats.com.
As one can see, the current value of SGS Alternate CPI, at 8.51%, is considerably higher than that of CPI, at 1.17%. As seen on the chart, this large disparity has existed for years.
The need for an accurate understanding of the rate of inflation (or deflation) can hardly be overstated. Everything ranging from policy decisions to standard of living issues is impacted. Needless to say, inflation at roughly 5-10% (a range seen in the SGS Alternate CPI since the early 90's) is much different than that seen in the CPI figures. This difference is really magnified once one compounds these annual rates.
I like to think of the inflation / deflation issue in a different light than that seen in the CPI or SGS Alternate CPI terms; and as such, do not "endorse" either. However, I think it is important to recognize and follow both the CPI and SGS Alternate CPI trends.
_____
A Special Note concerning our economic situation is found here SPX at 1217.90 as this post is written
From the homepage, "The Billion Prices Project is an academic initiative that collects prices from hundreds of online retailers around the world on a daily basis to conduct economic research."
Two of the most prominent benefits I see from the data include that data is available daily and it serves as a comparison and is plotted against the CPI (last available data) for references purposes. The current (as of 11-22-10) "Billion Prices" index value for the U.S. is 100.51.
As well, data is available for a number of countries.
This data from "The Billion Prices Project" should be interesting to monitor going forward...
A Special Note concerning our economic situation is found here SPX at 1180.73 as this post is written
"And long before this recession hit -- for a decade -- middle-class families had already been expensing -- experiencing a sense of declining economic security. Their paychecks were flat-lining even though the cost of everything from groceries to college educations to health care were all going up."
President Obama, during an April 2, 2010 speech
______
Although the CPI and various other cost and inflation indices have been relatively subdued for many years, it is inarguable that many costs routinely experienced by the average American have dramatically increased. Perhaps the main resultant effect of these cost increases are for the average citizen to (continually) experience a declining standard of living.
Over the last few months, many costs have been rising sharply. These cost increases are most pronounced among many commodities, as discussed in this April 23 Wall Street Journal article "High Cost of Raw Materials."
These pervasive cost increases are also impacting many businesses in pronounced ways. I will be discussing this in a subsequent post as these impacts are little understood, yet will likely have large future effects.
The strong price action of gold lately has been interesting.
As seen in the daily price chart, the $1000 level has been a pivotal area.
For a variety of reasons I am closely watching whether this $1000 price level will be surpassed. I am under the impression, due to a variety of factors, that either gold will soon strongly surpass this $1000 level, or fail to and begin a strong descent. In essence, I think we have approached the "moment of truth" for gold, and it will "break" from this $1000 level decisively either up or down.
As many know, gold has a long-standing reputation as performing strongly during what is perceived to be inflationary conditions. As such, how it performs here in the short-term could prove instructive on this topic, which would impact many other markets.
The hyperinflation / inflation / deflation debate is of foremost importance at this time for many reasons. How this debate is "answered" will have vast implications for investors, business, and the nation's financial standing.
I recently came across an interesting chart titled "Relationship Of Inflation and Price/Earnings Ratios (1900-2008)." It is from Crestmont Research and can be found at this link:
The "inflation is good for stocks" theory is widely held. The logic says that inflation promotes higher revenue and earnings. In my opinion this logic is theoretically flawed and/or incomplete. From a practical perspective, history shows it isn't justified, as indicated in the chart.
Furthermore, even if inflation were to appear favorable to stock prices, one has to view the stock market returns on a "real" basis.
Much has been written in the financial press about the possibility of impending inflation, or even hyperinflation. These possibilities are discussed as being likely due to the “loose” monetary policy that has been enacted to combat The Financial Crisis.
If one were to believe that inflation has or will soon “breakout,” one would probably expect gold to perform strongly. At around the current 930 level, gold has “held its own” over the last year, but certainly hasn’t put in what might be called a strong performance, all things considered.
One measure that I follow is the ratio of HUI (an index of gold stocks) to that of the physical metal itself. One theory, perhaps the predominant one, is that the gold stocks should move, or at least verify, the price movements of the physical gold itself. Looking at the weekly chart (seen below) over the last 10 years seems to indicate that although gold has been relatively buoyant over the last year, the gold stocks, as seen by the HUI Index, have lagged since early 2008. One interpretation of this is that the gold stocks are not confirming the move in gold, meaning that gold may soon head down, which could indicate that inflation fears are overstated.
The inflation/reflation/deflation issue is critical to The Financial Crisis. Most people with an opinion on the matter think that deflation isn’t a major threat. While the HUI:Gold ratio is only one measure that can be used, it is important to see what it is indicating at the moment with regard to the inflation/reflation/deflation issue.