Wednesday, November 30, 2011

Defining An Economic Depression


What is the official definition of an (economic) depression? Although the term is often heard, the term seems to lack a well-structured definition.

There is a section discussing depressions on The NBER's Business Cycle Dating Procedure:  Frequently Asked Questions page.  As seen in the discussion, it says:
The term depression is often used to refer to a particularly severe period of economic weakness. Some economists use it to refer only to the portion of these periods when economic activity is declining. The more common use, however, also encompasses the time until economic activity has returned to close to normal levels. The most recent episode in the United States that is generally regarded as a depression occurred in the 1930s.
also:
However, just as the NBER does not define the term depression or identify depressions, there is no formal NBER definition or dating of the Great Depression.
A January 14, 2009 article in Forbes, titled "What Is A Depression, Anyway?" also examines the issue as to how a depression is defined, and finds "While there's a fairly standard definition for a recession (two quarters of shrinking gross domestic product), there isn't one for a depression."  However, the article later states with regard to a depression:
... a 10% contraction is often cited as the tipping point.
A March 10, 2009 CalculatedRisk blog post titled "What is a depression?" also examines the issue.  An excerpt:
Although there is no formal definition, most economists agree it is a prolonged slump with a 10% or more decline in real GDP.
As well, other sources confirm the lack of a standardized definition, although the 10% decline in economic activity (measured via real GDP) is most commonly cited.
_____

The Special Note summarizes my overall thoughts about our economic situation

SPX at 1195.19 as this post is written
Monday, November 28, 2011

Economic Forecast Efficacy Of Recent Years


On November 25, the Liberty Street Economics blog (Federal Reserve Bank of New York) published a post titled "The Failure to Forecast the Great Recession."

The post examines the inability of the New York Fed, as well as the vast majority of professional forecasters in general, to predict the "Great Recession."  It also mentions the failure of forecasters to predict the decline in housing.

Although I found the entire post to be worthwhile, here are a few notable excerpts:
Economic forecasters never expect to predict precisely. One way of measuring the accuracy of their forecasts is against previous forecast errors. When judged by forecast error performance metrics from the macroeconomic quiescent period that many economists have labeled the Great Moderation, the New York Fed research staff forecasts, as well as most private sector forecasts for real activity before the Great Recession, look unusually far off the mark.
also:
On the basis of their analysis, one could have expected that an October 2007 forecast of real GDP growth for 2008 would be within 1.3 percentage points of the actual outcome 70 percent of the time. The New York Fed staff forecast at that time was for growth of 2.6 percent in 2008. Based on the forecast of 2.6 percent and the size of forecast errors over the Great Moderation period, one would have expected that 70 percent of the time, actual growth would be within the 1.3 to 3.9 percent range. The current estimate of actual growth in 2008 is-3.3 percent, indicating that our forecast was off by 5.9 percentage points.
Using a similar approach to Reifschneider and Tulip but including forecast errors for 2007, one would have expected that 70 percent of the time the unemployment rate in the fourth quarter of 2009 should have been within 0.7 percentage point of a forecast made in April 2008. The actual forecast error was 4.4 percentage points, equivalent to an unexpected increase of over 6 million in the number of unemployed workers. Under the erroneous assumption that the 70 percent projection error band was based on a normal distribution, this would have been a 6 standard deviation error, a very unlikely occurrence indeed.
The post also examines more recent (April 2011) forecast performance, and finds that "the level of real activity in 2011 has been disappointing relative to expectations."

My comments:

Economic forecasts and their accuracy is of great importance for a variety of reasons.  It is because of this importance that this blog features many economic forecasts and financial market predictions.

I have previously commented on forecasters' inability to predict the adverse financial events of 2007-2010.   As well, a page titled "Predictions" serves as "a brief recap (in no way all-inclusive) of some forecasts and predictions that have been made during the Financial Crisis."

The accuracy of predictions prior to and during the "The Great Recession" serves as a reminder to how difficult financial crises, and their impacts, are to predict.  The inability to predict "The Great Recession" should serve to cast uncertainty on forecasters' ability to predict future severe economic weakness, especially since the level of complexity inherent in the overall economic environment is, according to my analyses, growing.
_____

The Special Note summarizes my overall thoughts about our economic situation

SPX at 1194.85 as this post is written

Wednesday, November 23, 2011

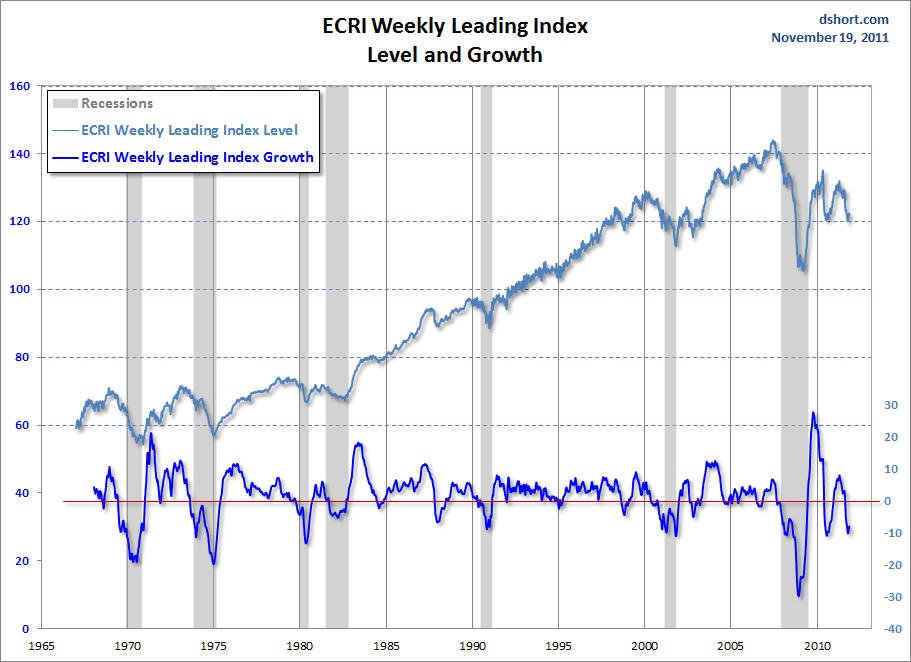
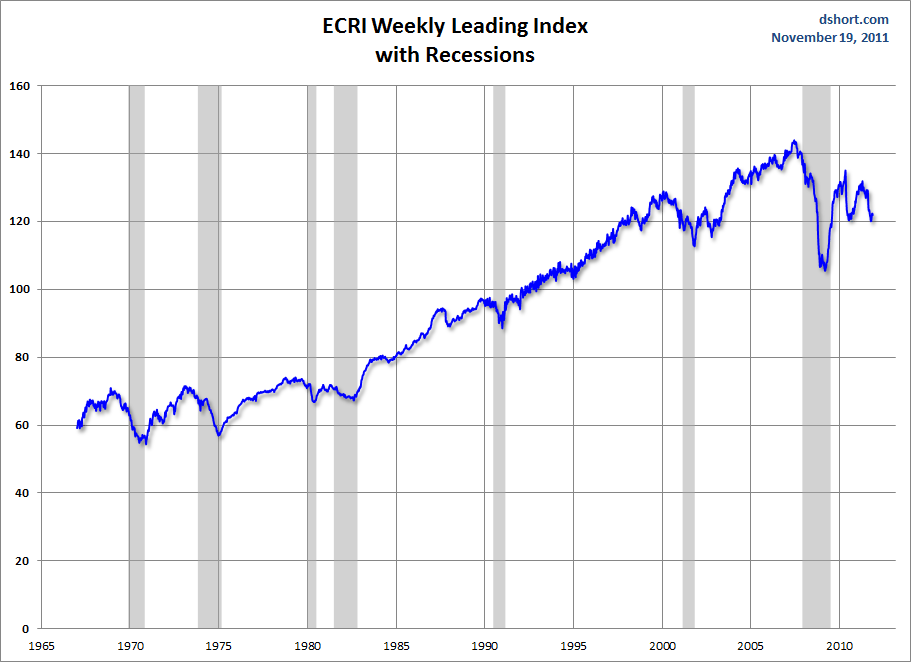
Long-Term Chart Of The ECRI Weekly Leading Index (WLI)


On an intermittent basis I have commented on ECRI's methodologies and its indices, including the WLI Growth.  I include the WLI Growth in the monthly update of economic indicators.

Although ECRI's WLI Growth measure receives far greater attention, it should also be noted that there is a ECRI WLI (Weekly Leading Index) from which the WLI Growth measure is derived.

Here is a simple definition of the U.S. Weekly Leading Index, as seen in the ECRI glossary:
The WLI is a forward-looking composite leading index that anticipates cyclical turning points in U.S. economic activity by 2-3 quarters. Updates are available on Friday mornings to members at 9:00 AM and to the public at 10:30 AM. The monthly data starts in 1949, and the weekly data in 1967.
For reference purposes, here are two charts that depict the ECRI WLI.  Both are from Doug Short's post of November 21.  The first is a long-term weekly chart of the ECRI WLI:


-

This next chart depicts both the WLI and WLI Growth measures, as noted, for comparison:


_____

The Special Note summarizes my overall thoughts about our economic situation

SPX at 1167.43 as this post is written

Tuesday, November 22, 2011

Updates On Economic Indicators November 2011


Here is an update on various indicators that are supposed to predict and/or depict economic activity.  These indicators have been discussed in previous blog posts:

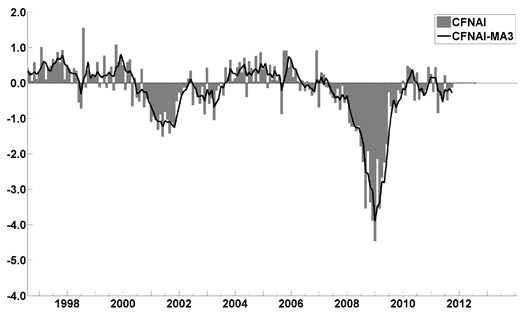
The November Chicago Fed National Activity Index (CFNAI)(pdf) updated as of November 21, 2011:


-


An excerpt from the November 8 update titled “Index forecasts weaker growth” :
The October update of the USA TODAY/IHS Global Insight Economic Outlook Index shows real GDP growth, at a six-month annualized growth rate, slowing to 1.1% by March. Persistent unemployment, elevated debt levels, high energy and food prices and low confidence have stalled consumer spending. Businesses are hesitant to expand amid uncertainty.
-


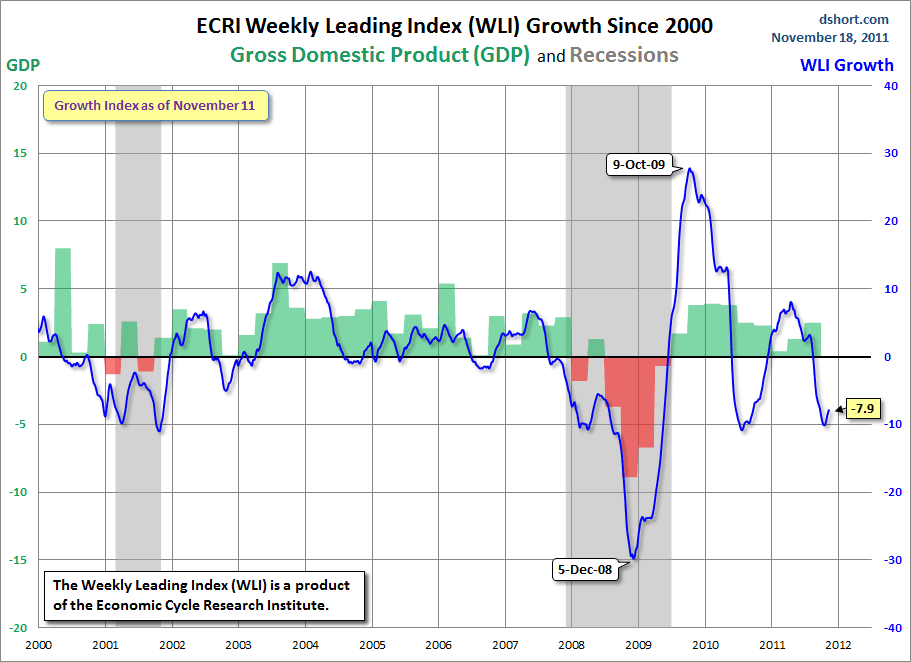
As of 11/11/11 the WLI was at 122.1 and the WLI, Gr. was at -7.8%.

A chart of the WLI Growth since 2000, from Doug Short's blog of November 18 titled "ECRI Recession Watch:  Decline in Growth Index Continues to Moderate" :


-


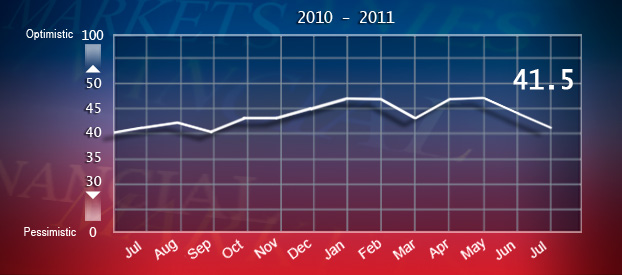
The Indicator as of August 31 was at 41.5, as seen below:


-


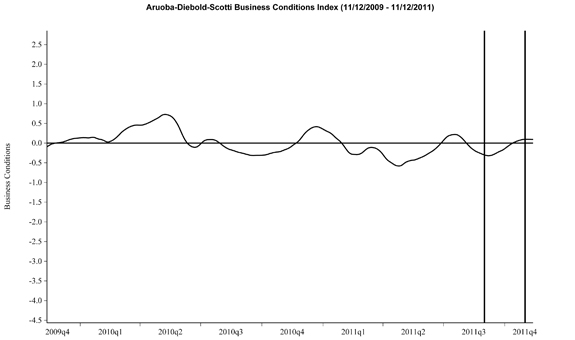
Here is the latest chart, depicting 11-12-09 to 11-12-11:

-


As per the November 18 release, the LEI was at 117.4 and the CEI was at 103.5 in October.

An excerpt from the November 18 release:
Says Ataman Ozyildirim, economist at The Conference Board: “The October rebound of the LEI — largely due to the sharp pick-up in housing permits — suggests that the risk of an economic downturn has receded. Improving consumer expectations, stock markets, and labor market indicators also contributed to this month’s gain in the LEI as did the continuing positive contributions from the interest rate spread. The CEI also rose somewhat, led by higher industrial production and employment.”
_________

I post various indicators and indices because I believe they should be carefully monitored.  However, as those familiar with this blog are aware, I do not necessarily agree with what they depict or imply.
_____

The Special Note summarizes my overall thoughts about our economic situation

SPX at 1192.98 as this post is written

Monday, November 21, 2011

The November 2011 Wall Street Journal Economic Forecast Survey


The November Wall Street Journal Economic Forecast Survey was published on November 10, 2011.  The headline is “Economists See Smaller Chance of U.S. Recession."

I found various aspects of the survey to be interesting, including the following excerpts:
The 52 economists surveyed in November—not all of whom answer every question—put 1-in-4 odds that the U.S. will experience a recession in the next 12 months, down from a 1-in-3 chance they were seeing just two months ago, when concerns were at their highest level since the recent recession ended in June 2009.
also:
The economists, on average, put 2-in-3 odds that the euro zone will fall into recession.

The current average forecasts among economists polled include the following:

GDP:
full-year 2011 : 1.7%
full-year 2012:  2.3%
full-year 2013:  2.6%

Unemployment Rate:
December 2011: 9.0%
December 2012: 8.7%
December 2013: 8.1%

10-Year Treasury Yield:
December 2011: 2.17%
December 2012: 2.79%
December 2013: 3.36%

CPI:
December 2011:  3.3%
December 2012:  2.2%
December 2013:  2.3%

Crude Oil  ($ per bbl):
for 12/31/2011: $88.68
for 12/31/2012: $91.60

(note: I comment upon this survey each month; commentary on past surveys can be found under the “Economic Forecasts” label)
_____

I post various economic forecasts because I believe they should be carefully monitored.  However, as those familiar with this blog are aware, I do not necessarily agree with many of the consensus estimates and much of the commentary in these forecast surveys.
_____

The Special Note summarizes my overall thoughts about our economic situation

SPX at 1192.98 as this post is written

"America's New Poor" Segment - Notable Excerpts


Yesterday, CBS aired a segment on its "Sunday Morning" show titled "America's new poor."

While dynamics similar to those discussed in the segment have been noted in previous posts on this blog, this segment is yet another notable reminder of the changing economic condition and the growing need for food assistance.  This segment focuses on an area, Forsyth County, near Atlanta.

Here are some excerpts that I find especially notable:

But for more families here, prosperity is a pretense. The job's lost, the savings are gone, and the big house is either in foreclosure or on its way. And just keeping food on the table is a struggle.
So Forsyth's newly-needy file into local food banks.
Yesterday's GIVERS have become today's TAKERS.
also:
"The new poor could be you, me, your neighbor, your church member, somebody who has been affected by the economy," she said. "Many of our people who have come for assistance used to be our donors. And they'll say, 'I never thought I'd have to do this, never in my wildest dreams.'"
also:
Nearly 15 percent of Americans are now receiving food stamps, a record level, and a jump of about two-thirds since 2007.
One in SIX Americans - 49 million people - say they have trouble putting food on the table.
At Forsyth County's Lambert High, eight percent of kids now get free lunch, double the number three years ago.
_____

The Special Note summarizes my overall thoughts about our economic situation

SPX at 1215.65 as this post is written

Friday, November 18, 2011

Building Financial Danger - An Update


On October 17 I wrote a post titled "Danger Signs In The Stock Market, Financial System And Economy."  This post is a brief update to that post.

My overall analysis continues to indicate that there is an elevated and growing level of danger.

Many prominent parties seem to be fixated on the European financial problems, and seem to be overlooking other problem areas.  While I believe that the European debt problems are very serious and have broader implications, (as explained in yesterday's post "Europe And Contagion - Broader Implications") the other problems are of great concern as well.

Overall, my analysis indicates that this continues to be an environment of rising risks and therefore is dangerous in nature.  As far as the stock market is concerned, the situation as described in the October 20 post ("Thoughts On The Next Stock Market Decline") still applies.

As reference, below is one view of the stock market that I find interesting.  It is a 1-year daily chart of the S&P500 (through November 17) with annotations by Ron Walker of the The Chart Pattern Trader:

(click on chart to enlarge image)(chart courtesy of StockCharts.com, annotations by Ron Walker)


_____

The Special Note summarizes my overall thoughts about our economic situation

SPX at 1216.13 as this post is written

Thursday, November 17, 2011

Europe And Contagion - Broader Implications


Yesterday, The Wall Street Journal had an article titled "Turmoil Spreads in Europe."  The subtitle is "Bond Market Selloff Hits Nations Seen as Healthy, Raising Specter of Contagion."

An excerpt:
Europe's debt troubles on Tuesday spilled over to top-rated nations that had been largely untouched by the crisis—including Austria, the Netherlands, Finland and France—in an ominous sign for European policy makers.
My comments:

I continue to believe that "contagion" already exists.

Also, the broader implication of the European situation - and one that is entirely lacking recognition -   is whether the overall concept of sovereign debt is (in the process of) being repudiated.  If so - and it appears too early to definitively answer - the implications are massive.

Here is what I wrote about both of these issues in a January 10 article titled "10 'Front and Center' Problem Areas That Pose a Threat to the Economy" :
European debt crisis: This situation appears to be unresolved in many respects. In fact, it almost appears to be a slow-spreading contagion. One interpretation of this overall situation is that it may signal a repudiation of (sovereign) debt. Should this interpretation prove accurate, it would not bode well for our highly-indebted global economy.
_____

The Special Note summarizes my overall thoughts about our economic situation

SPX at 1230.63 as this post is written

Wednesday, November 16, 2011

Walmart’s Q3 2012 Results – Comments


I found various notable items in Walmart’s Q3 conference call transcript (pdf) dated November 15, 2011.  I view Walmart’s results and comments as particularly noteworthy given their retail prominence and focus on low prices.  I have previously commented on their quarterly results; these previous posts are found under the “paycheck to paycheck” label.

Here are various excerpts that I find most notable:

comments from Mike Duke, page 7:
While we feel good about the progress in our stores, our customers remain concerned about jobs, and only one in 10 Walmart Moms that we surveyed view the state of the U.S. economy as good.  They want to save money. They’re juggling credit cards, using coupons, and skipping restaurants and vacations. There is a real sense that the economic strain is taking its toll.
from Bill Simon, page 14:
Economic conditions in the third quarter remained largely unchanged.  Our core customer was still impacted by high unemployment and continued uncertainty over the economy, leading to declining consumer confidence. Although they remained higher than a year ago, gas prices, which positively affect customer trips, moderated during the quarter.
from Bill Simon, page 14:
Rising food costs continue to be a major concern for customers. We hear from some shoppers that they believe it will be more difficult than ever to afford holiday meals for their families.
from Bill Simon, page 14:
As others in the industry reported, customers continue to see food prices rise in key categories, such as produce, dairy and meat. Walmart continues to invest in absorbing some of these increases to ensure price leadership in our markets. During the quarter, grocery inflation was approximately 4 percent, in line with what’s been seen throughout the industry. But given our price investment, the impact to our customers was substantially less.
from Bill Simon, page 16:
Customer feedback on the return of layaway has been overwhelmingly positive and layaway transaction volume continues to exceed plan. Our customers tell us that they appreciate that we’ve brought back this service, and it’s a great way to help families on a tight budget shop for Christmas. As a reminder, we’ve added service fees to reduce layaway cancellations in the fourth quarter.
_____

The Special Note summarizes my overall thoughts about our economic situation

SPX at 1247.72 as this post is written

Tuesday, November 15, 2011

Philadelphia Fed – 4th Quarter 2011 Survey Of Professional Forecasters


The Philadelphia Fed Fourth Quarter 2011 Survey of Professional Forecasters was released on November 14.  This survey is somewhat unique in various regards, such as it incorporates a longer time frame for various measures.

The survey shows, among many measures, the following expectations:

GDP:

full-year 2011 : 1.8%
full-year 2012 : 2.4%
full-year 2013 : 2.7%
full-year 2014 : 3.5%

Unemployment Rate: (annual average level)

for 2011: 9.0%
for 2012: 8.8%
for 2013: 8.4%
for 2014: 7.8%

-

As for “the chance of a contraction in real GDP in any of the next four quarters,” estimates range from 11.8-17.3% for each of the quarters through Q4 2012.

As well, there are also a variety of time frames shown (present through the year 2020) with the expected inflation of each.  Inflation is measured in Headline and Core CPI and Headline and Core PCE.  Over all time frames expectations are shown to be in the 1.4-3.6% range.

_____

I post various economic forecasts because I believe they should be carefully monitored.  However, as those familiar with this blog are aware, I do not agree with many of the consensus estimates and much of the commentary in these forecast surveys.

_____

The Special Note summarizes my overall thoughts about our economic situation

SPX at 1257.81 as this post is written

Monday, November 14, 2011

November 10 Gallup Poll On Americans’ Ability To Afford Food – Notable Excerpts


In the October 17 post ("Danger Signs In The Stock Market, Financial System And Economy") I mentioned in point #6 "...numerous signs of broad-based financial strain among households."

A November 10 Gallup poll titled "Americans' Ability to Afford Food Nears Three-Year Low" illustrates one of these strains.

Here are what I found as the most notable excerpts from the poll results:
The percentage of Americans reporting that they had enough money to buy the food they or their families needed continued to decline in October, nearing the record low seen in November 2008. The percentage who did not lack money for food in 2011 fell to 79.8% from 80.1% in September, continuing a decline that began in April.
also:
This measure -- which asks if one had enough money to buy food in the past 12 months -- has decreased to its lowest level of the calendar year each October since 2009. The reason for this pattern is unclear and does not appear to be related to world food prices.
also:
Americans' access to basic needs is now at the lowest level recorded since Gallup and Healthways began tracking it in January 2008. The Basic Access Index -- which comprises 13 measures, including Americans' ability to afford food, housing, and healthcare -- declined to a record-low score of 81.2 in October. This means Americans' access to basic needs, though still high in an absolute sense, is now worse than it was throughout the economic crisis and recession, including the prior record lows recorded in February and March 2009.
_____

The Special Note summarizes my overall thoughts about our economic situation

SPX at 1263.85 as this post is written

Friday, November 11, 2011

Financial Stocks – November 11 Update Concerning Poor “Price Action”


On June 29 I wrote a blog post titled “Financial Stocks – Notable Price Action.”

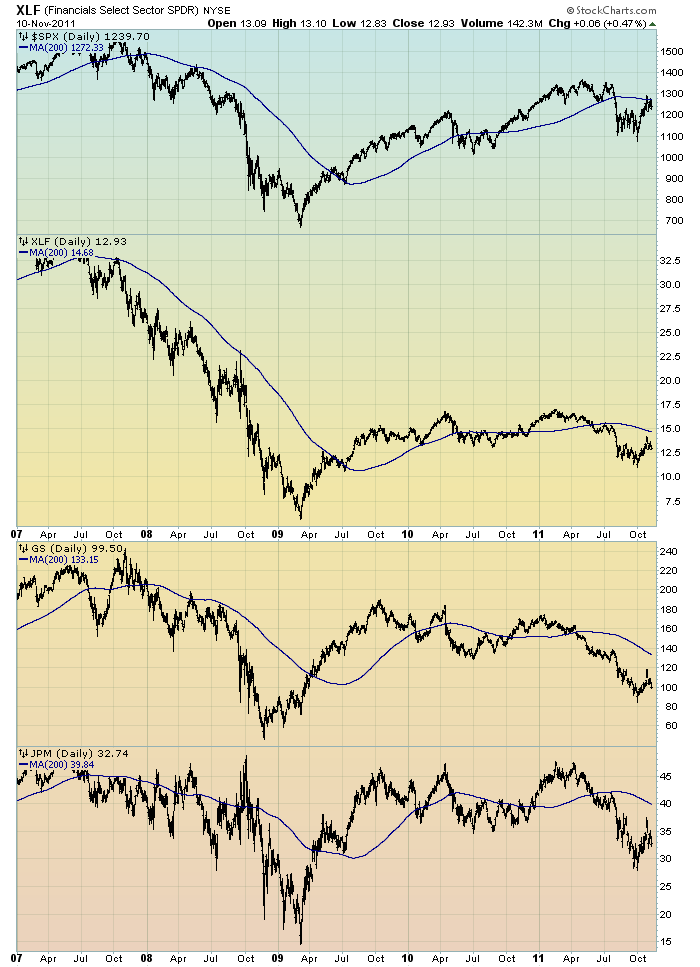
I continue to believe that the “price action” of various financial stocks is disconcerting.  I view the poor performance of these financial and brokerage stocks to be one indicator among (very) many that serves as a “red flag” as to the financial markets and economy as a whole.

Here is an updated chart to that June 29 post.  It shows the XLF (the financial ETF) on a daily basis since 2007.  As well, the S&P500 is plotted above it, with GS and JPM shown below it.  The blue line on each indicates the 200dma:

(click on chart image to enlarge)(chart courtesy of StockCharts.com; chart created by and annotated by author)


_____

The Special Note summarizes my overall thoughts about our economic situation

SPX at 1239.70 as this post is written

Thursday, November 10, 2011

Financial Stocks – Relative Price To Overall Stock Market - November 10 2011 Update


In the June 29 post (“Financial Stocks – Notable Price Action”) I wrote the following:
I think that the relatively poor “price action” of various financial stocks is notable.  It is one of many current indications that overall stock market health is not as strong as a casual glance at the major indices would indicate.
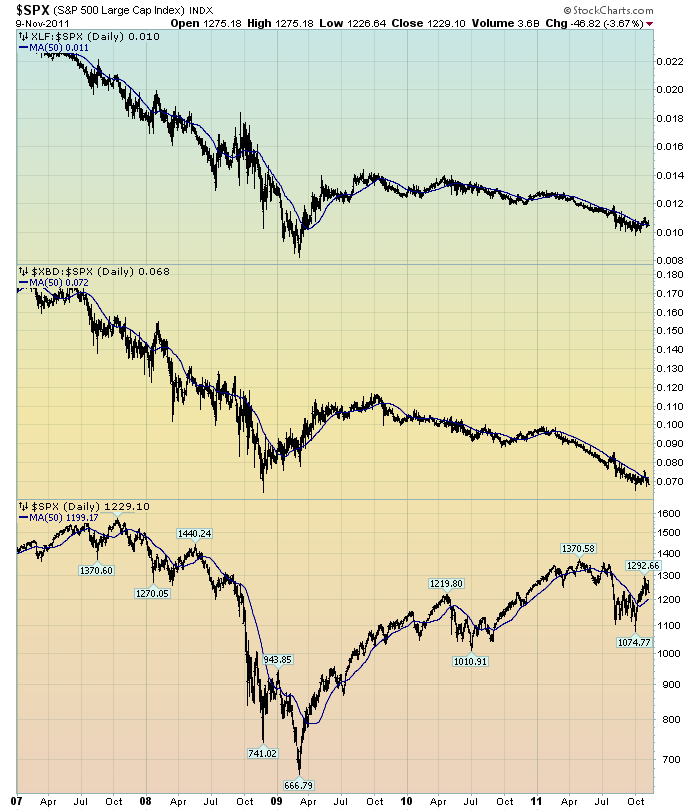
I continue to believe that the lagging / “sagging” price of various financial stocks is highly notable.  Here is another chart that I created a while ago that provides another view of the poor “price action” of the financial stocks vs. that of the entire stock market, as depicted by the S&P500:

(click on chart to enlarge image)(chart courtesy of StockCharts.com; chart created by and annotated by author)


-

The above chart is depicted on a daily basis, LOG scale, since 2007.   On each of the three plots, a blue line depicts the 50dma for perspective.

As one can see, there has been an interesting progression of the relative price of the XLF (Financial SPDR) vs. the S&P500, as seen in the top of the chart.  In the middle of the chart, the same can be seen in the $XBD (Broker/Dealer Index).  Generally, since mid-2009, the price of both the XLF and $XBD have been on a slow downward trajectory relative to the price of the S&P500.  The S&P500 is plotted on the bottom of the chart.

In my experience, any time the financials lag the general stock market for a considerable period, it is generally a “red flag” that should be closely monitored.

_____

The Special Note summarizes my overall thoughts about our economic situation

SPX at 1229.10 as this post is written

Wednesday, November 9, 2011

NFIB Small Business Optimism – October 2011


The October NFIB Small Business Optimism was released November 8.  The headline of the Press Release is “Small Business Optimism Has Minor Uptick: Optimism Index Slight Uptick Still Weighed Down by Dominant Negative Forecast.”

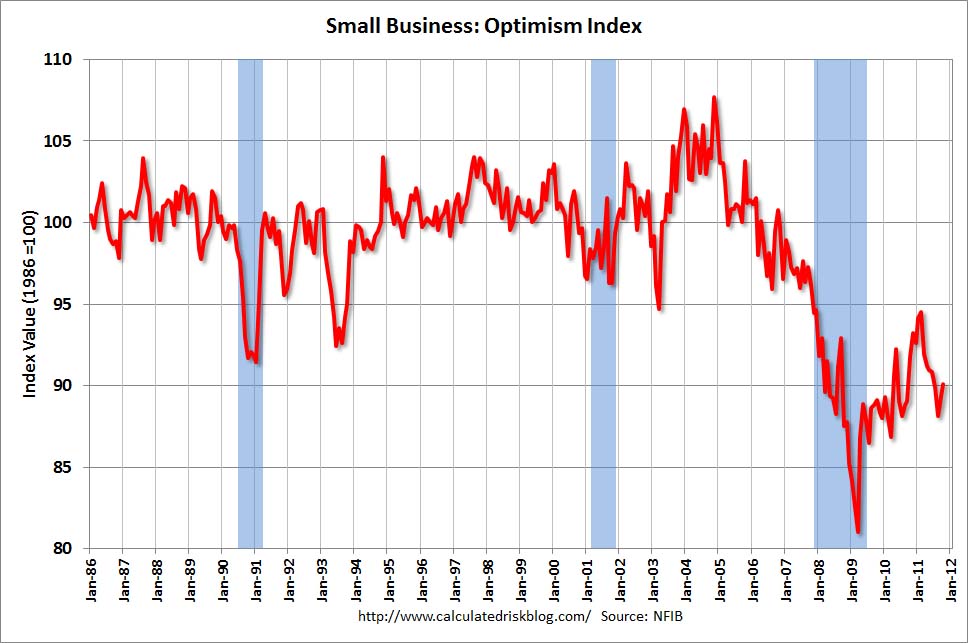
The Index of Small Business Optimism increased 1.3 points in October, rising to 90.2.

Here are some excerpts from the report that I find particularly notable:
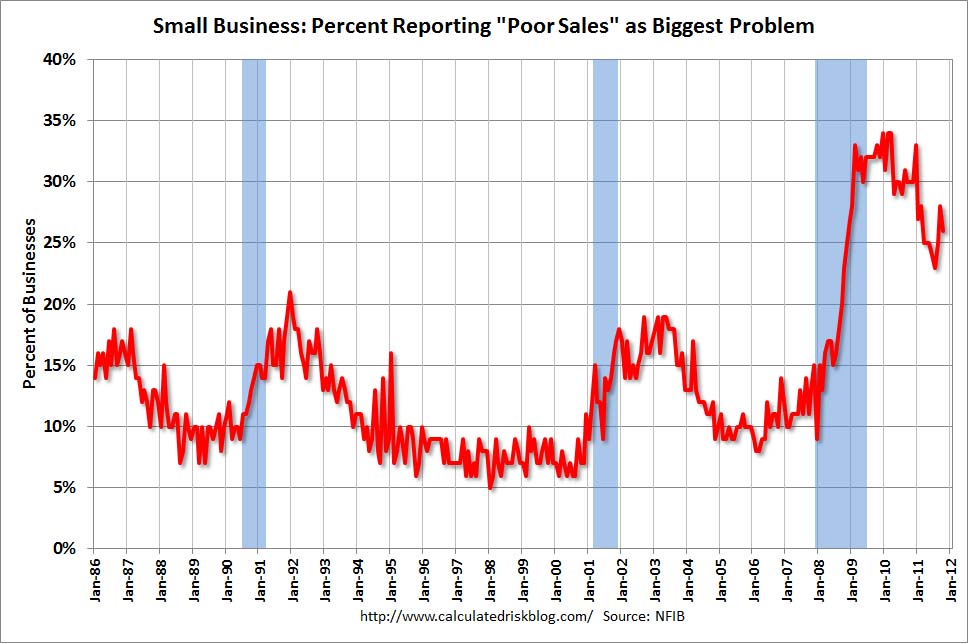
“Consumer sentiment remains at very low levels and is reflected in the 26 percent of small business owners who cite ‘poor sales’ as their biggest problem,” said NFIB Chief Economist Bill Dunkelberg. “There is no exuberance in spending, as consumers ‘make do’ rather than spend their increased savings in upgrades or new purchases. It’s that extra spending that would provide small business owners a reason to hire and order more inventory, the best stimulus we could have. But confidence is the key and right now there isn’t much."
also:
October’s survey shows that optimism improved a smidge, but mostly because the outlook for business conditions and real sales growth became less negative. However, these two Index components are still solidly negative and at recession levels.
also:
Four percent of owners reported financing as their most important business problem. So, for the overwhelming majority, credit availability is not a significant problem. Ninety-one percent reported that all their credit needs were met or that they were not interested in borrowing. Nine percent reported that not all of their credit needs were satisfied, the record low is 4 percent reached in 2000.
In conjunction with this October NFIB Small Business Optimism Survey, the CalculatedRisk blog on November 8 (in a post titled “NFIB:  Small Business Optimism Index increases slightly in October") had three charts that depicted various facets (the Index itself; Hiring Plans and Poor Sales) of the Survey, as shown below:

(click on charts to enlarge images)


_____

The Special Note summarizes my overall thoughts about our economic situation

SPX at 1243.70 as this post is written

Tuesday, November 8, 2011

Market Action During Periods Of Intervention - Chart Since 2007


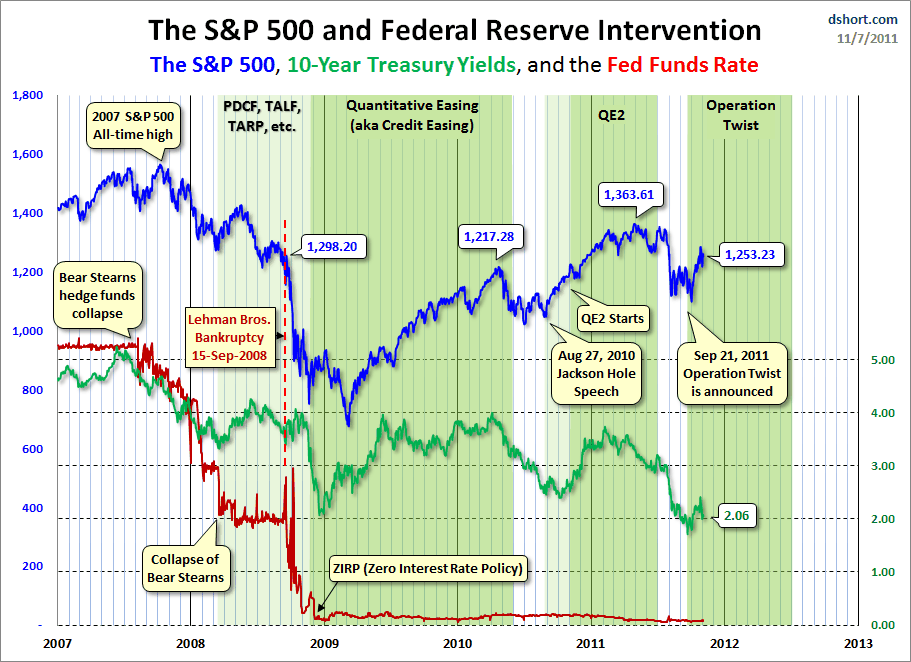
In the August 9 post ("QE3 - Various Thoughts") I posted a chart that depicted the movements of the S&P500, 10-Year Treasury Yield and the Fed Funds rate spanning the periods of various interventions since 2007.

For reference purposes, here is an updated chart from Doug Short’s blog post of November 7 (“Fed Intervention and the Market") :

(click on chart to enlarge image)


_____

The Special Note summarizes my overall thoughts about our economic situation

SPX at 1261.12 as this post is written

Monday, November 7, 2011

Ben Bernanke’s November 2 Press Conference – Notable Aspects


On Wednesday November 2 Ben Bernanke gave his scheduled Press Conference.

Here are Ben Bernanke’s comments I found most notable, although I don’t necessarily agree with them.  These comments are excerpted from the "Transcript of Chairman Bernanke's Press Conference" of November 2 2011 (preliminary) (pdf), with Bernanke’s responses as indicated to the various questions:

from page 4 (Opening Remarks):
In short, while we still expect that economic activity and labor market conditions, will improve gradually over time, the pace of the progress is likely to be frustratingly slow. Moreover, there are significant downside risks to the economic outlook. Most notably, concerns about European fiscal and banking issues have contributed to strains in global financial markets which have likely had adverse effects on confidence and growth.
from page 7:
Binyamin Appelbaum: Has the Fed discussed the idea of nominal GDP targeting and what are your views on the advantages and disadvantages of that approach?
Chairman Bernanke: So the Fed's mandate is of course a dual mandate.  We have a mandate for both employment and for price stability and we have a framework in place that allows us to communicate and to think about that, the two sides of that mandate. We talked today--or yesterday actually--about nominal GDP as indicators and information variable as something to add to the list of variables that we think about and it was a very interesting discussion. However, we think that within the existing framework that we have, which looks at both sides of the mandate, not just some combination of the two, we can communicate whatever we need to communicate about future monetary policy. So we are not contemplating at this at this time any radical change in framework. We're going to stay within the dual mandate approach that we've been using until this point.
from page 14:
Neil Irwin: Neil Irwin with the Washington Post. Mr. Chairman this is the third straight set of economic projections released that have downgraded forecasts for growth and for employment. I wonder, is there some systematic error, some blind spot that's behind these kind of overly optimistic forecasts? What are you doing internally to understand what you got wrong the last two projections?
Chairman Bernanke: Well, it's a perfectly fair question. And, you know, we spend a lot of time reviewing those errors, the staff in particular presents us with information on --on forecast errors and on revisions, et cetera. And so we look at that very carefully. I think it's clear that in retrospect that the severity of the financial crisis and a number of other problems including the dysfunction of the housing market have been more severe and more persistent than we initially believed and that together with a number of other phenomena like deleveraging by the household sector and so on has slowed the pace of recovery. So, yes, we have again downgraded the medium-term forecast, evidently the forces--you know, the drags on the recovery were stronger than we thought. I would add, however, though that although I think it's very important to look at the fundamental factors affecting the recovery, there's been some elements of bad luck. For example this year, the combination of the natural disaster in Japan, which had global impacts in terms of growth; oil price increases; the European debt crisis, which was not anticipated to be as severe and has created as much volatilities as it has in financial markets, all those things had been negatives for growth and they do explain at least part of the--of the downward revision.
from page 15:
Michael McKee: Michael McKee with Bloomberg Television. Many Americans wonder what the Fed has actually accomplished with its monetary policy actions since about QE2. Fed officials like to talk about the effect they've had on interest rates but the economy seems insensitive to interest rates these days. Can you explain what you have managed to accomplish? Can you tell us whether you feel your mandate requires you to do anything you can think of on an ongoing basis until some targets are met? And can you explain to the average American why you're doing what you're doing? And do you think that you risk credibility if the average American doesn't see some sort of improvement in the economy?
Chairman Bernanke: No, it's a fair question. I would first say that our monetary policy is having effects on the economy and we've talked about the effects on asset prices but we have continued to analyze the effects of changes in interest rates for example on decisions like investment or car purchases. One area where monetary policy has been blunted, the effects have been blunted, has been the mortgage market where very tight credit standards have prevented many people from purchasing or refinancing their homes and therefore the low mortgage rates that we've achieved have not been as effective as we had hoped.  So, monetary policy maybe is somewhat less powerful in the current  context than it has been in the past but nevertheless it is affecting  economic growth and job creation. If you ask about the accomplishments, I would first of all mention a very important one which is that we have kept inflation close to 2 percent on average, which both has avoided the problems of high inflation but also very importantly has avoided the risk of deflation. And we have seen in other countries, in other contexts that deflation can be a very pernicious problem and very difficult to get out of once you are there. So, we have been able to achieve on average stable prices. With respect to growth, I think that our policies including the cutting rates to zero in December 2008 and the, the first round of--of asset purchases in the fall of '08 and in the spring of '09 were very important for helping to explain why the economy stopped contracting and began to grow again in the middle of 2009. I think there's a lot of evidence that that did promote growth and job creation. I would argue that we've also been successful with some of the later actions that we've taken, although it's early to say for things like the maturity extension program. But we always face the problem of asking the question of: Where we would be without these policies? And our best estimates are that absent the support of monetary policy that the economy would be in a much deeper ditch and that unemployment would be much higher than it is. That being said, you know, again people rightly recognize that we have not yet gotten the economy back to where we want it to be and their dissatisfaction is perfectly understandable. Yes, I do think that with, you know, that we do need to do whatever we can to move the economy towards price stability and maximum employment. We'll continue to do that so long as the tools that we have are efficacious and that they don't have costs or risks or negative side effects that are worse than the benefits, we'll always be making that evaluation.
_____

The Special Note summarizes my overall thoughts about our economic situation

SPX at 1253.23 as this post is written