In the last post (“4 Confidence Charts – April 2, 2012 Update") I displayed four charts indicating various long-term consumer and small business confidence readings as compared to the S&P500.
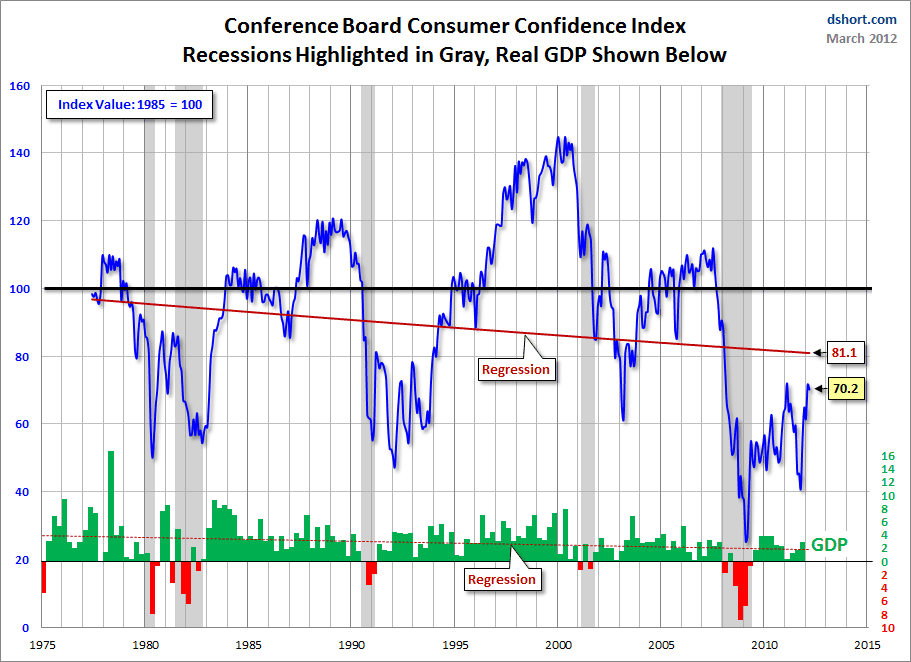
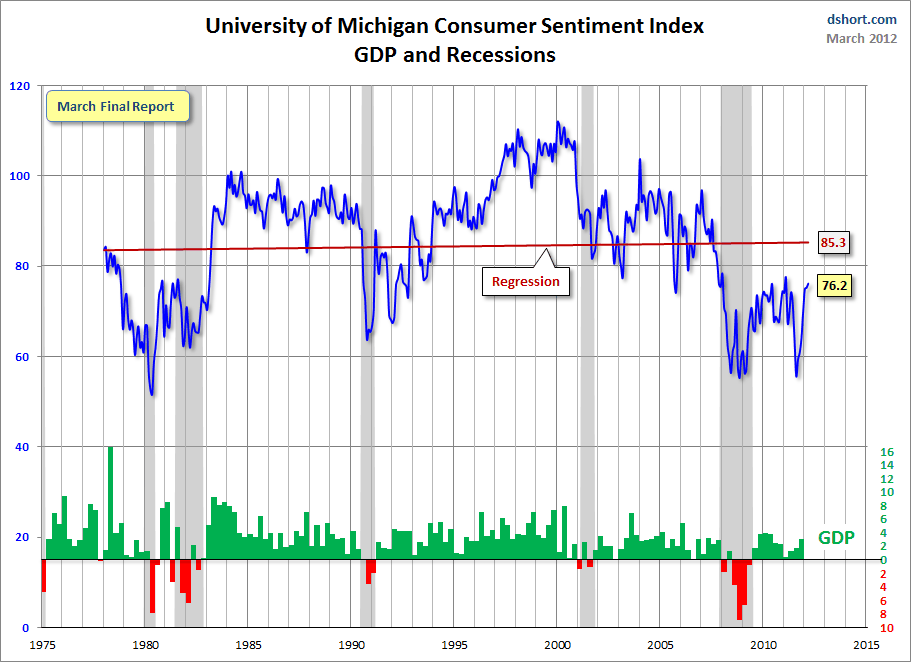
Doug Short had a blog post of March 30 ("Michigan Consumer Sentiment: Highest Since February 2011") in which he presents the Conference Board and University of Michigan charts in a different fashion. They are presented below:
(click on charts to enlarge images)
-
-
There are a few aspects of the above charts that I find highly noteworthy. Of course, the continuing very subdued absolute levels of these two surveys is disconcerting.
Also, I find the “behavior” of these readings to be quite disparate as compared to the other post-recession periods, as shown in the charts between the gray shaded areas (the gray areas denote recessions as defined by the NBER.)
While I don’t believe that confidence surveys should be overemphasized, I find these readings to be very problematical, especially in light of a variety of other highly disconcerting measures highlighted in this blog.
_____
The Special Note summarizes my overall thoughts about our economic situation
SPX at 1408.47 as this post is written


No comments:
Post a Comment