Here is an update on various indicators that are supposed to predict and/or depict economic activity. These indicators have been discussed in previous blog posts:
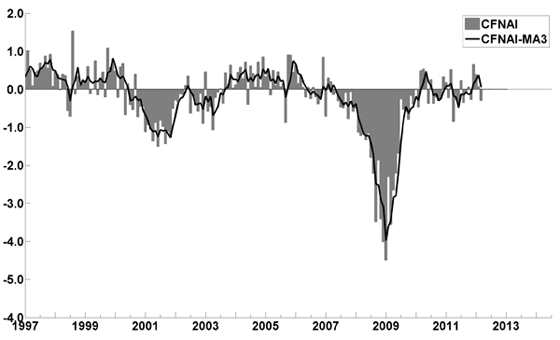
The April Chicago Fed National Activity Index (CFNAI)(pdf) updated as of April 26, 2012:
-
An excerpt from the March 22 update titled “Index forecasts weaker growth” :
The February update of the USA TODAY/IHS Global Insight Economic Outlook Index shows real GDP growth, at a six-month annualized growth rate, increasing to 2.5% in March and April and then slowing to 2.1% in July. While employment, housing (mostly the multifamily sector) and consumer spending are slowly recovering, concerns about the Eurozone and world growth continue.
-
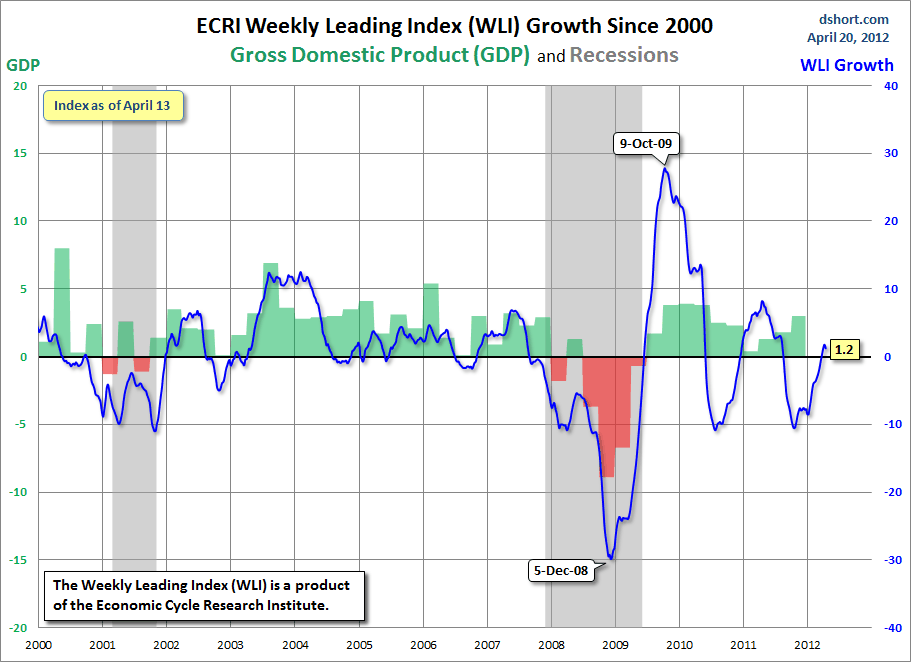
As of 4/20/12 the WLI was at 123.9 and the WLI, Gr. was at 1.2%.
A chart of the WLI, Gr. since 2000, from Doug Short’s blog of April 20 titled “ECRI Weekly Leading Indicator: The Growth Index Slips” :
-
no current value available
-
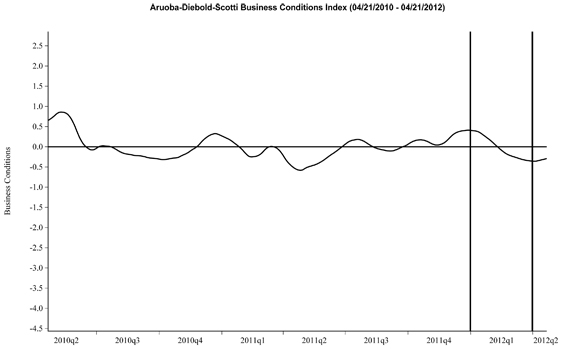
Here is the latest chart, depicting 4-21-10 to 4-21-12:
-
As per the April 19 release, the LEI was at 95.7 and the CEI was at 104.2 in March.
An excerpt from the April 19 release:
Says Ken Goldstein, economist at The Conference Board: “Despite relatively weak data on jobs, home building and output in the past month or two, the indicators signal continued economic momentum. We expect a gradual improvement in growth past the summer months.”
_________
I post various indicators and indices because I believe they should be carefully monitored. However, as those familiar with this blog are aware, I do not necessarily agree with what they depict or imply.
_____
The Special Note summarizes my overall thoughts about our economic situation
SPX at 1399.98 as this post is written


No comments:
Post a Comment