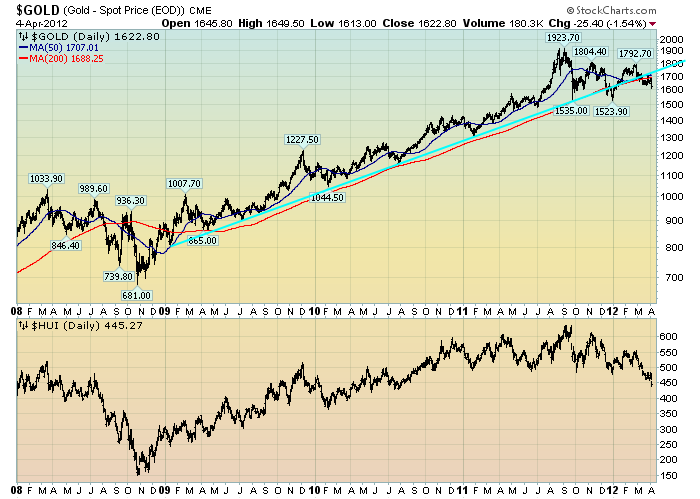
Gold has been in a correction (or consolidation) after a very steep rally.
It appears as if Gold is at a critical juncture at present. The chart below depicts Gold on a daily basis, LOG scale, since 2008, as well as the HUI (Gold Bugs) stock index. Gold, at $1622.80/oz, is currently below both the 200dma (depicted in red) as well as the 50dma (depicted in blue). A rising trendline (broken to the downside) since early 2009 is shown in cyan:
(click on chart to enlarge image)(chart courtesy of StockCharts.com; chart creation and annotation by the author)
-
I have written of the broader implications of Gold’s price movements. In one post, that of August 25, 2011 ("Gold And Deflationary Pressures") I wrote the following, which I continue to believe is applicable:
I am very closely monitoring Gold as I believe a steep, abnormal correction could serve to (further) indicate deflationary pressures – which of course would have outsized impacts on financial markets, the economy, and economic policy (particularly QE3 or some other large intervention.)
_____
The Special Note summarizes my overall thoughts about our economic situation
SPX at 1398.97 as this post is written

No comments:
Post a Comment