Wednesday, February 16, 2022

The Belief That Current Inflation Levels Will Increase

A few days ago (February 8, 2022) I wrote a post titled “The Belief That Current Inflation Levels Will Subside.” That post discussed various reasons that support the belief that the current high level of inflation will be transitory, i.e. inflation will subside over the next few months at which point it will then stabilize. This belief is the consensus among economists and other professional forecasters, and is seen in forecasts from the Federal Reserve.

However, there are many reasons to believe that inflation will increase from these levels, perhaps substantially. Of course, should this increase occur, it would create an array of problems. Due to the perniciousness of inflation – especially high levels of inflation – “price stability” has been one of two long-stated main goals of the Federal Reserve as seen in the Federal Reserve’s “Dual Mandate.”

Perhaps the main reason to believe that inflation will increase from these levels is that increases so far have been largely unforeseen, and that such increases have been of an outsized magnitude. As well, as further discussed below, there are many highly notable aspects of the current U.S. economic and financial situation which can (substantially) worsen inflation.

For reference, here are some charts of the most commonly cited U.S. inflation measure, headline CPI, at 7.5% as of the latest update of February 10, 2022 (from the January 2022 CPI report):
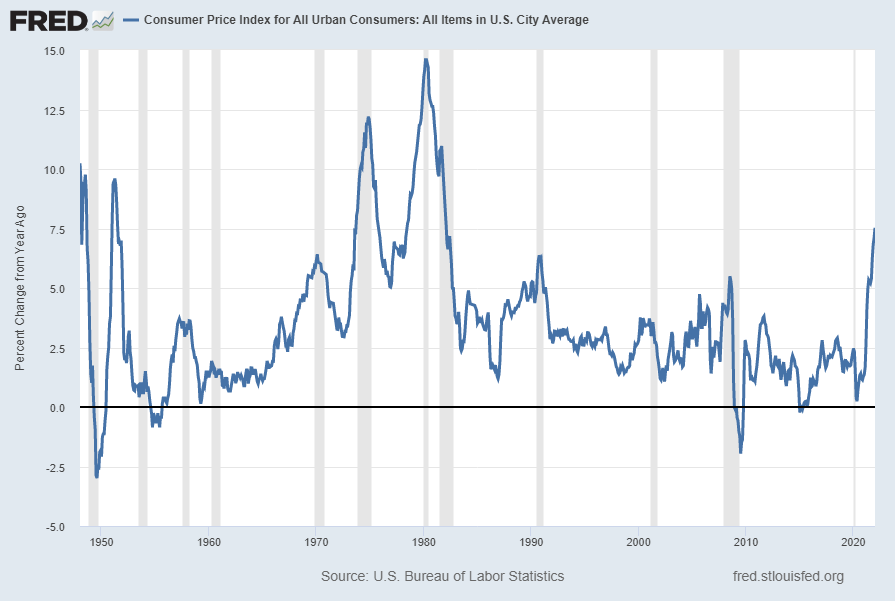
Consumer Price Index for All Urban Consumers - All Items in U.S. City Average Percent Change From Year Ago

source: U.S. Bureau of Labor Statistics, Consumer Price Index for All Urban Consumers: All Items in U.S. City Average [CPIAUCSL], retrieved from FRED, Federal Reserve Bank of St. Louis; accessed February 7, 2022: https://fred.stlouisfed.org/series/CPIAUCSL

As seen in the chart above, the level of CPI is at decade-high levels. The last time such a level was seen was in the early-80’s, which (of course) was considered a highly inflationary era. Of note, not only is inflation currently at a historically high level, but the inflation is very broad-based.

Here is this same CPI measure on a “Percent Change” (from prior month) basis, showing a January 2022 value of .6 Percent:
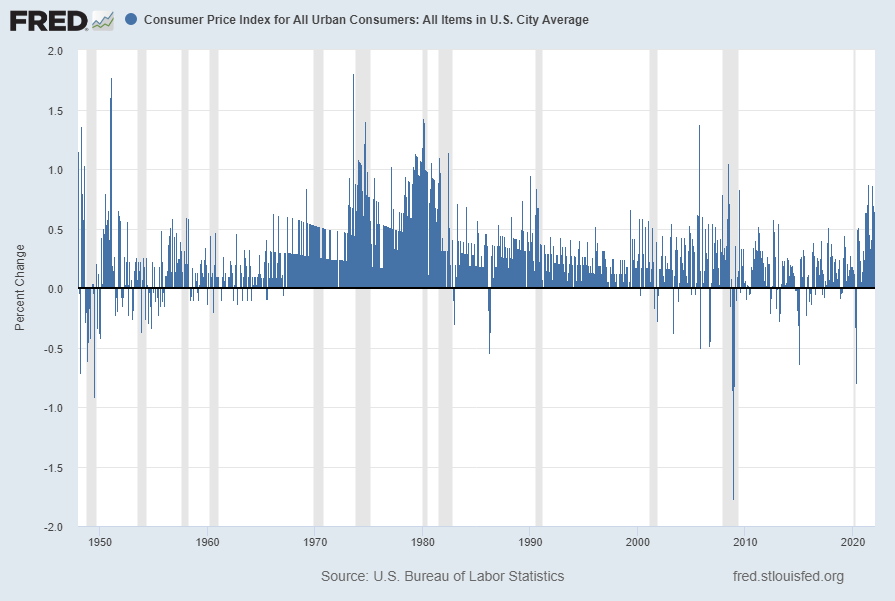
CPI Percent Change From Prior Month

Another measure that depicts an outsized level of inflation is the Federal Reserve Bank of Atlanta’s Core Flexible Price Consumer Price Index. As of the February 10, 2022 update the reading is at 18.99% as seen in the chart below:
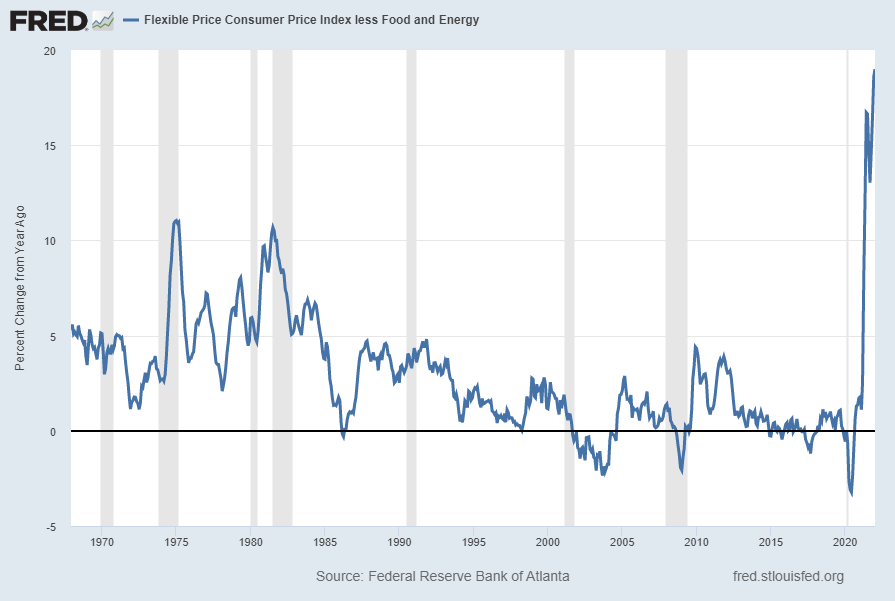
Flexible Price Consumer Price Index less Food and Energy

source: Federal Reserve Bank of Atlanta, Flexible Price Consumer Price Index less Food and Energy [COREFLEXCPIM159SFRBATL], retrieved from FRED, Federal Reserve Bank of St. Louis; accessed February 14, 2022: https://fred.stlouisfed.org/series/COREFLEXCPIM159SFRBATL

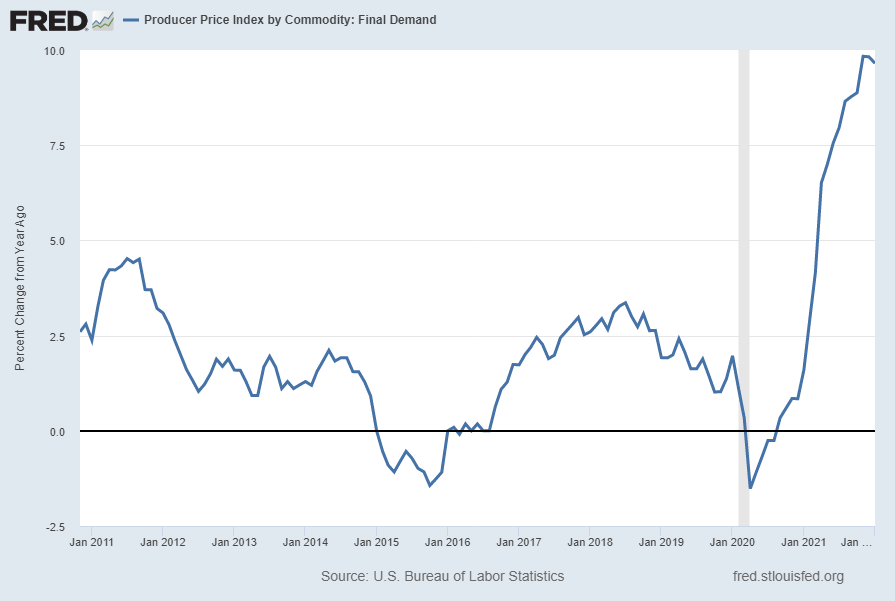
From the Producer Price Index report of January 2022, released February 15, 2022, here is the Producer Price Index by Commodity: Final Demand [PPIFID] currently showing a 9.7% Change From Year Ago:
Producer Price Index by Commodity: Final Demand

source: U.S. Bureau of Labor Statistics, Producer Price Index by Commodity: Final Demand [PPIFID], retrieved from FRED, Federal Reserve Bank of St. Louis; accessed February 15, 2022: https://fred.stlouisfed.org/series/PPIFID

Of note, various early-stage input prices, including many commodity prices, continue to sharply increase.

Another issue is whether various supply-chain issues are ameliorating with time. While various indexes and metrics have recently been introduced to measure supply-chain disruptions, from an all-things-considered basis it does not (yet) appear as if such issues are substantially diminishing.

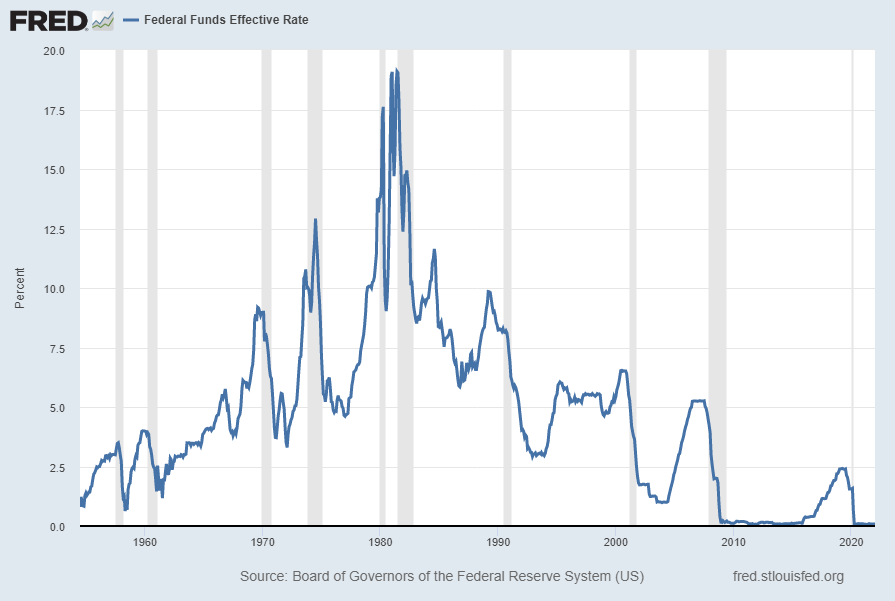
A paramount concern with regard to inflation is whether the Federal Reserve is adequately addressing it. In the past, most notably in the (late) 70’s – early 80’s era, the Federal Reserve raised rates sharply in an effort to diminish inflation.

In this current situation, the foremost question is whether the Fed is “behind the curve” with regard to the purported primary inflation remedy, that of raising interest rates. The Fed Funds Effective Rate as seen in the chart below remains at a negligible level (.08% as of the February 1, 2022 update):
Federal Funds Effective Rate

source: Board of Governors of the Federal Reserve System (US), Federal Funds Effective Rate [FEDFUNDS], retrieved from FRED, Federal Reserve Bank of St. Louis; accessed February 14, 2022: https://fred.stlouisfed.org/series/FEDFUNDS

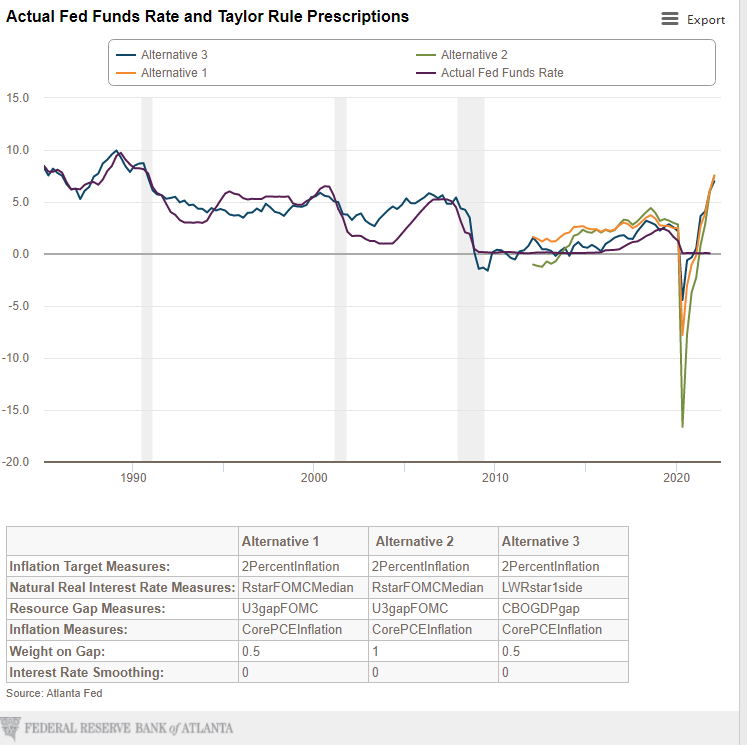
There are various indicators that can be used to gauge whether the current level of the Fed Funds Rate is appropriate. One such prominent measure is the Taylor Rule and the resulting Taylor Rule Prescription. Of note, the Taylor Rule Prescription can vary substantially depending upon which parameters are specified.

As seen on the Federal Reserve Bank of Atlanta’s site, the Taylor Rule prescription given the assigned factors is seen in the following chart, updated February 10, 2022:
Taylor Rule Prescription

As seen in the above chart, the Taylor Rule Prescription for the three alternatives shown range from 6.98% to 7.55% compared to the actual Fed Funds Rate of .09%.

Other indicators also imply that the Fed Funds Rate should be substantially higher than current levels.

As noted previously, there are many aspects of the current economic and financial situation which may serve to further extend the level and duration of inflation. A proper discussion of these factors and how they could substantially extend inflation would be both lengthy and complex.

One of these aspects is the possibility of a “wage-price spiral” occurring. Given various conditions, including widespread labor shortages in various sectors as well as wage growth that has been increasing, there is reason to believe that a “wage-price spiral” dynamic could occur. Such a dynamic would be (highly) problematical.

Lastly, if high levels of inflation persist – and further increase – there is a possibility of a hyperinflationary environment occurring. A hyperinflation would be exceedingly problematical.

_____

The Special Note summarizes my overall thoughts about our economic situation

SPX at 4443.32 as this post is written

Monday, February 14, 2022

Building Financial Danger – February 14, 2022 Update

My overall analysis indicates a continuing elevated and growing level of financial danger which contains many worldwide and U.S.-specific “stresses” of a very complex nature. I have written numerous posts on this site concerning both ongoing and recent “negative developments.”  These developments, as well as other exceedingly problematical conditions, have presented a highly perilous economic environment that endangers the overall financial system.

Also of ongoing immense importance is the existence of various immensely large asset bubbles, a subject of which I have extensively written.  While all of these asset bubbles are wildly pernicious and will have profound adverse future implications, hazards presented by the bond market bubble are especially notable.

Predicting the specific timing and extent of a stock market crash is always difficult, and the immense complexity of today’s economic situation makes such a prediction even more challenging. With that being said, my analyses continue to indicate that a near-term exceedingly large (from an ultra long-term perspective) stock market crash – that would also involve (as seen in 2008) various other markets – will occur. [note: the “next crash” and its aftermath has paramount significance and implications, as discussed in the post of January 6, 2012 titled “The Next Crash And Its Significance“ and various subsequent posts in the “Economic Depression” label]

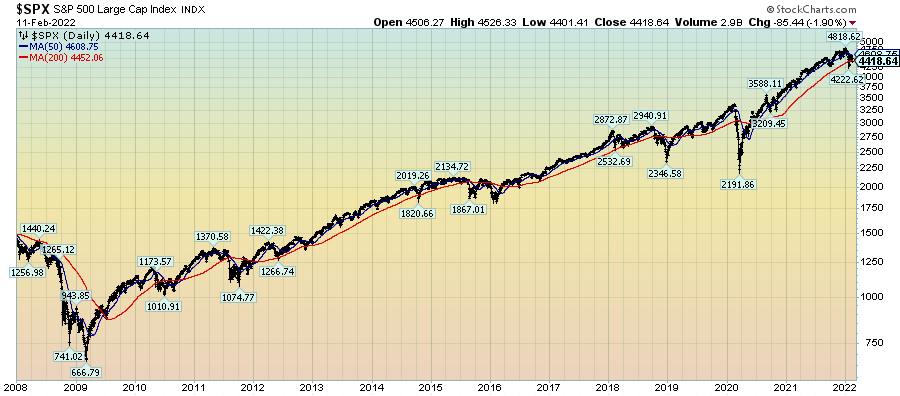
As reference, below is a daily chart since 2008 of the S&P500 (through February 11, 2022 with a last price of 4418.64), depicted on a LOG scale, indicating both the 50dma and 200dma as well as price labels:

(click on chart to enlarge image)(chart courtesy of StockCharts.com; chart creation and annotation by the author)

S&P500 since 2008

_____

The Special Note summarizes my overall thoughts about our economic situation

SPX at 4418.64 as this post is written
Friday, February 11, 2022

Philadelphia Fed – 1st Quarter 2022 Survey Of Professional Forecasters

The Philadelphia Fed 1st Quarter 2022 Survey of Professional Forecasters was released on February 11, 2022.  This survey is somewhat unique in various regards, such as it incorporates a longer time frame for various measures.

The survey shows, among many measures, the following median expectations:

Real GDP: (annual average level)

full-year 2022:  3.7%

full-year 2023:  2.7%

full-year 2024:  2.3%

full-year 2025:  2.3%

Unemployment Rate: (annual average level)

for 2022: 3.7%

for 2023: 3.4%

for 2024: 3.6%

for 2025: 3.7%

–

Regarding the risk of a negative quarter in real GDP in any of the next few quarters, mean estimates are 20.3%, 14.8%, 17.5%, 16.3% and 18.1% for each of the quarters from Q1 2022 through Q1 2023, respectively.

As well, there are also a variety of time frames shown (present quarter through the year 2030) with the median expected inflation (annualized) of each.  Inflation is measured in Headline and Core CPI and Headline and Core PCE.  Over all time frames expectations are shown to be in the 2.2% to 5.5% range.

_____

I post various economic forecasts because I believe they should be carefully monitored.  However, as those familiar with this site are aware, I do not agree with many of the consensus estimates and much of the commentary in these forecast surveys.

_____

The Special Note summarizes my overall thoughts about our economic situation

SPX at 4476.76 as this post is written
Long-Term Charts Of The ECRI WLI & ECRI WLI, Gr. – February 11, 2022 Update

 As I stated in my July 12, 2010 post (“ECRI WLI Growth History“):

For a variety of reasons, I am not as enamored with ECRI’s WLI and WLI Growth measures as many are.

However, I do think the measures are important and deserve close monitoring and scrutiny.

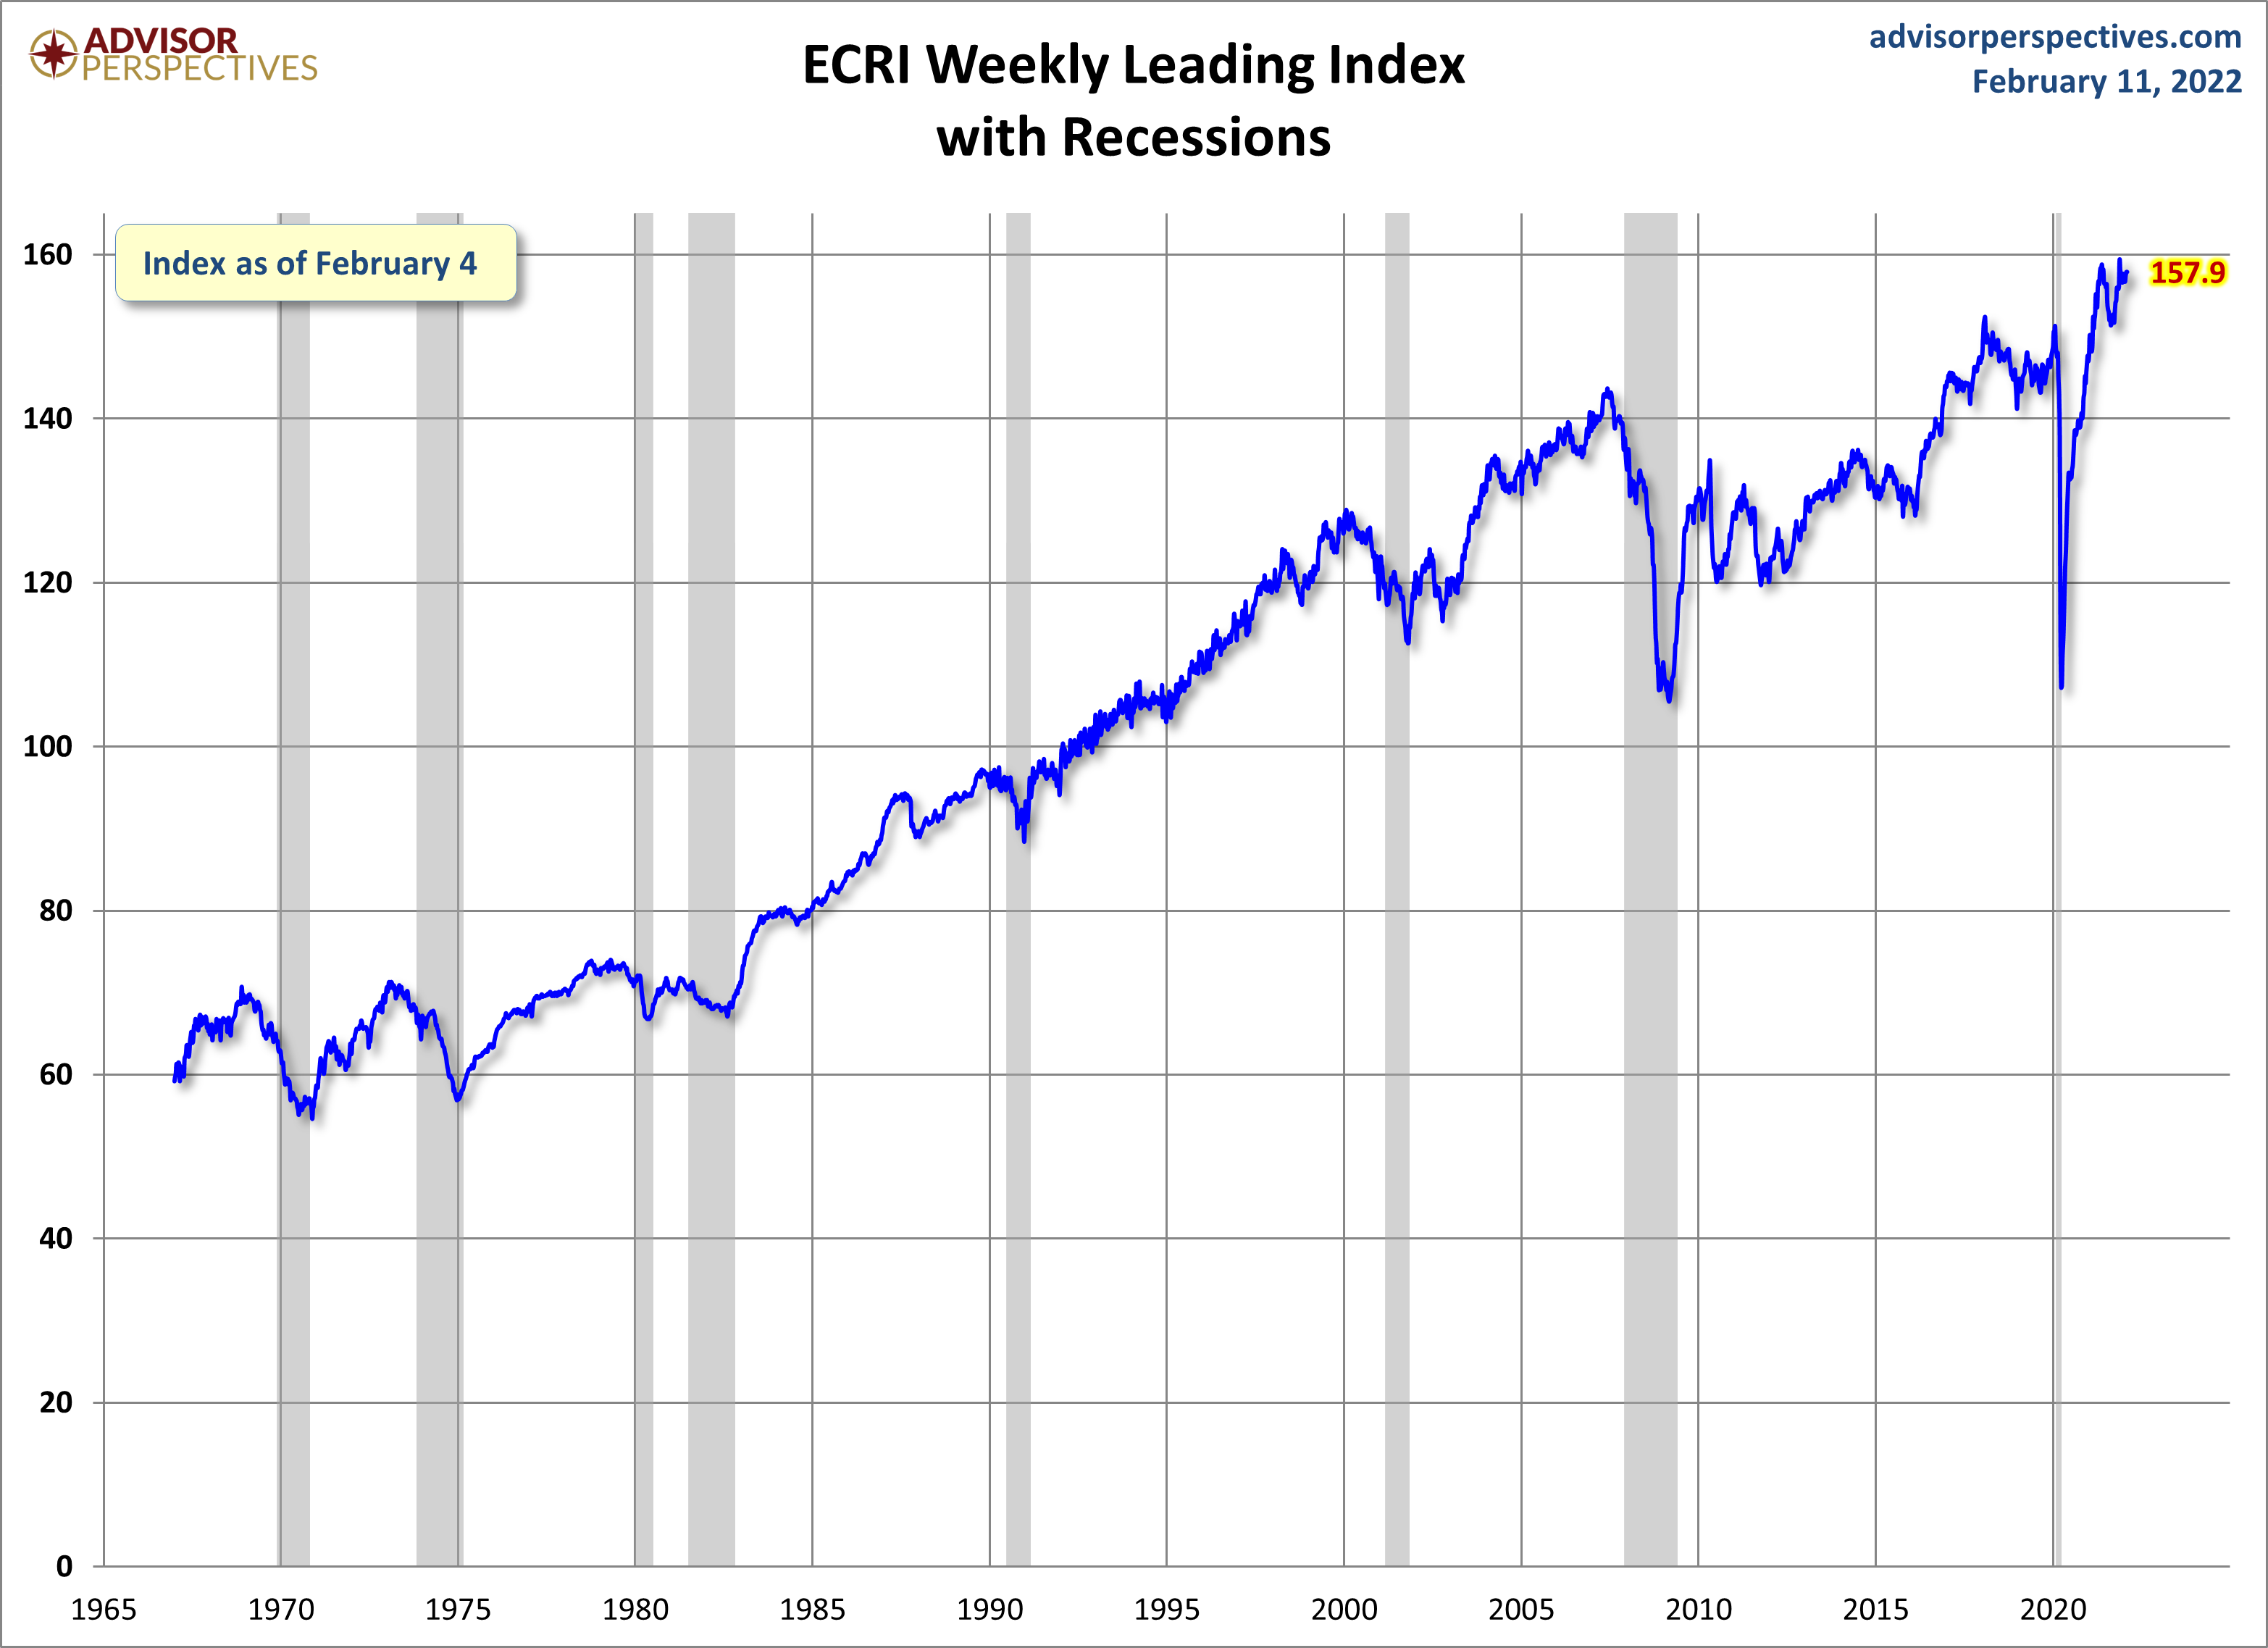
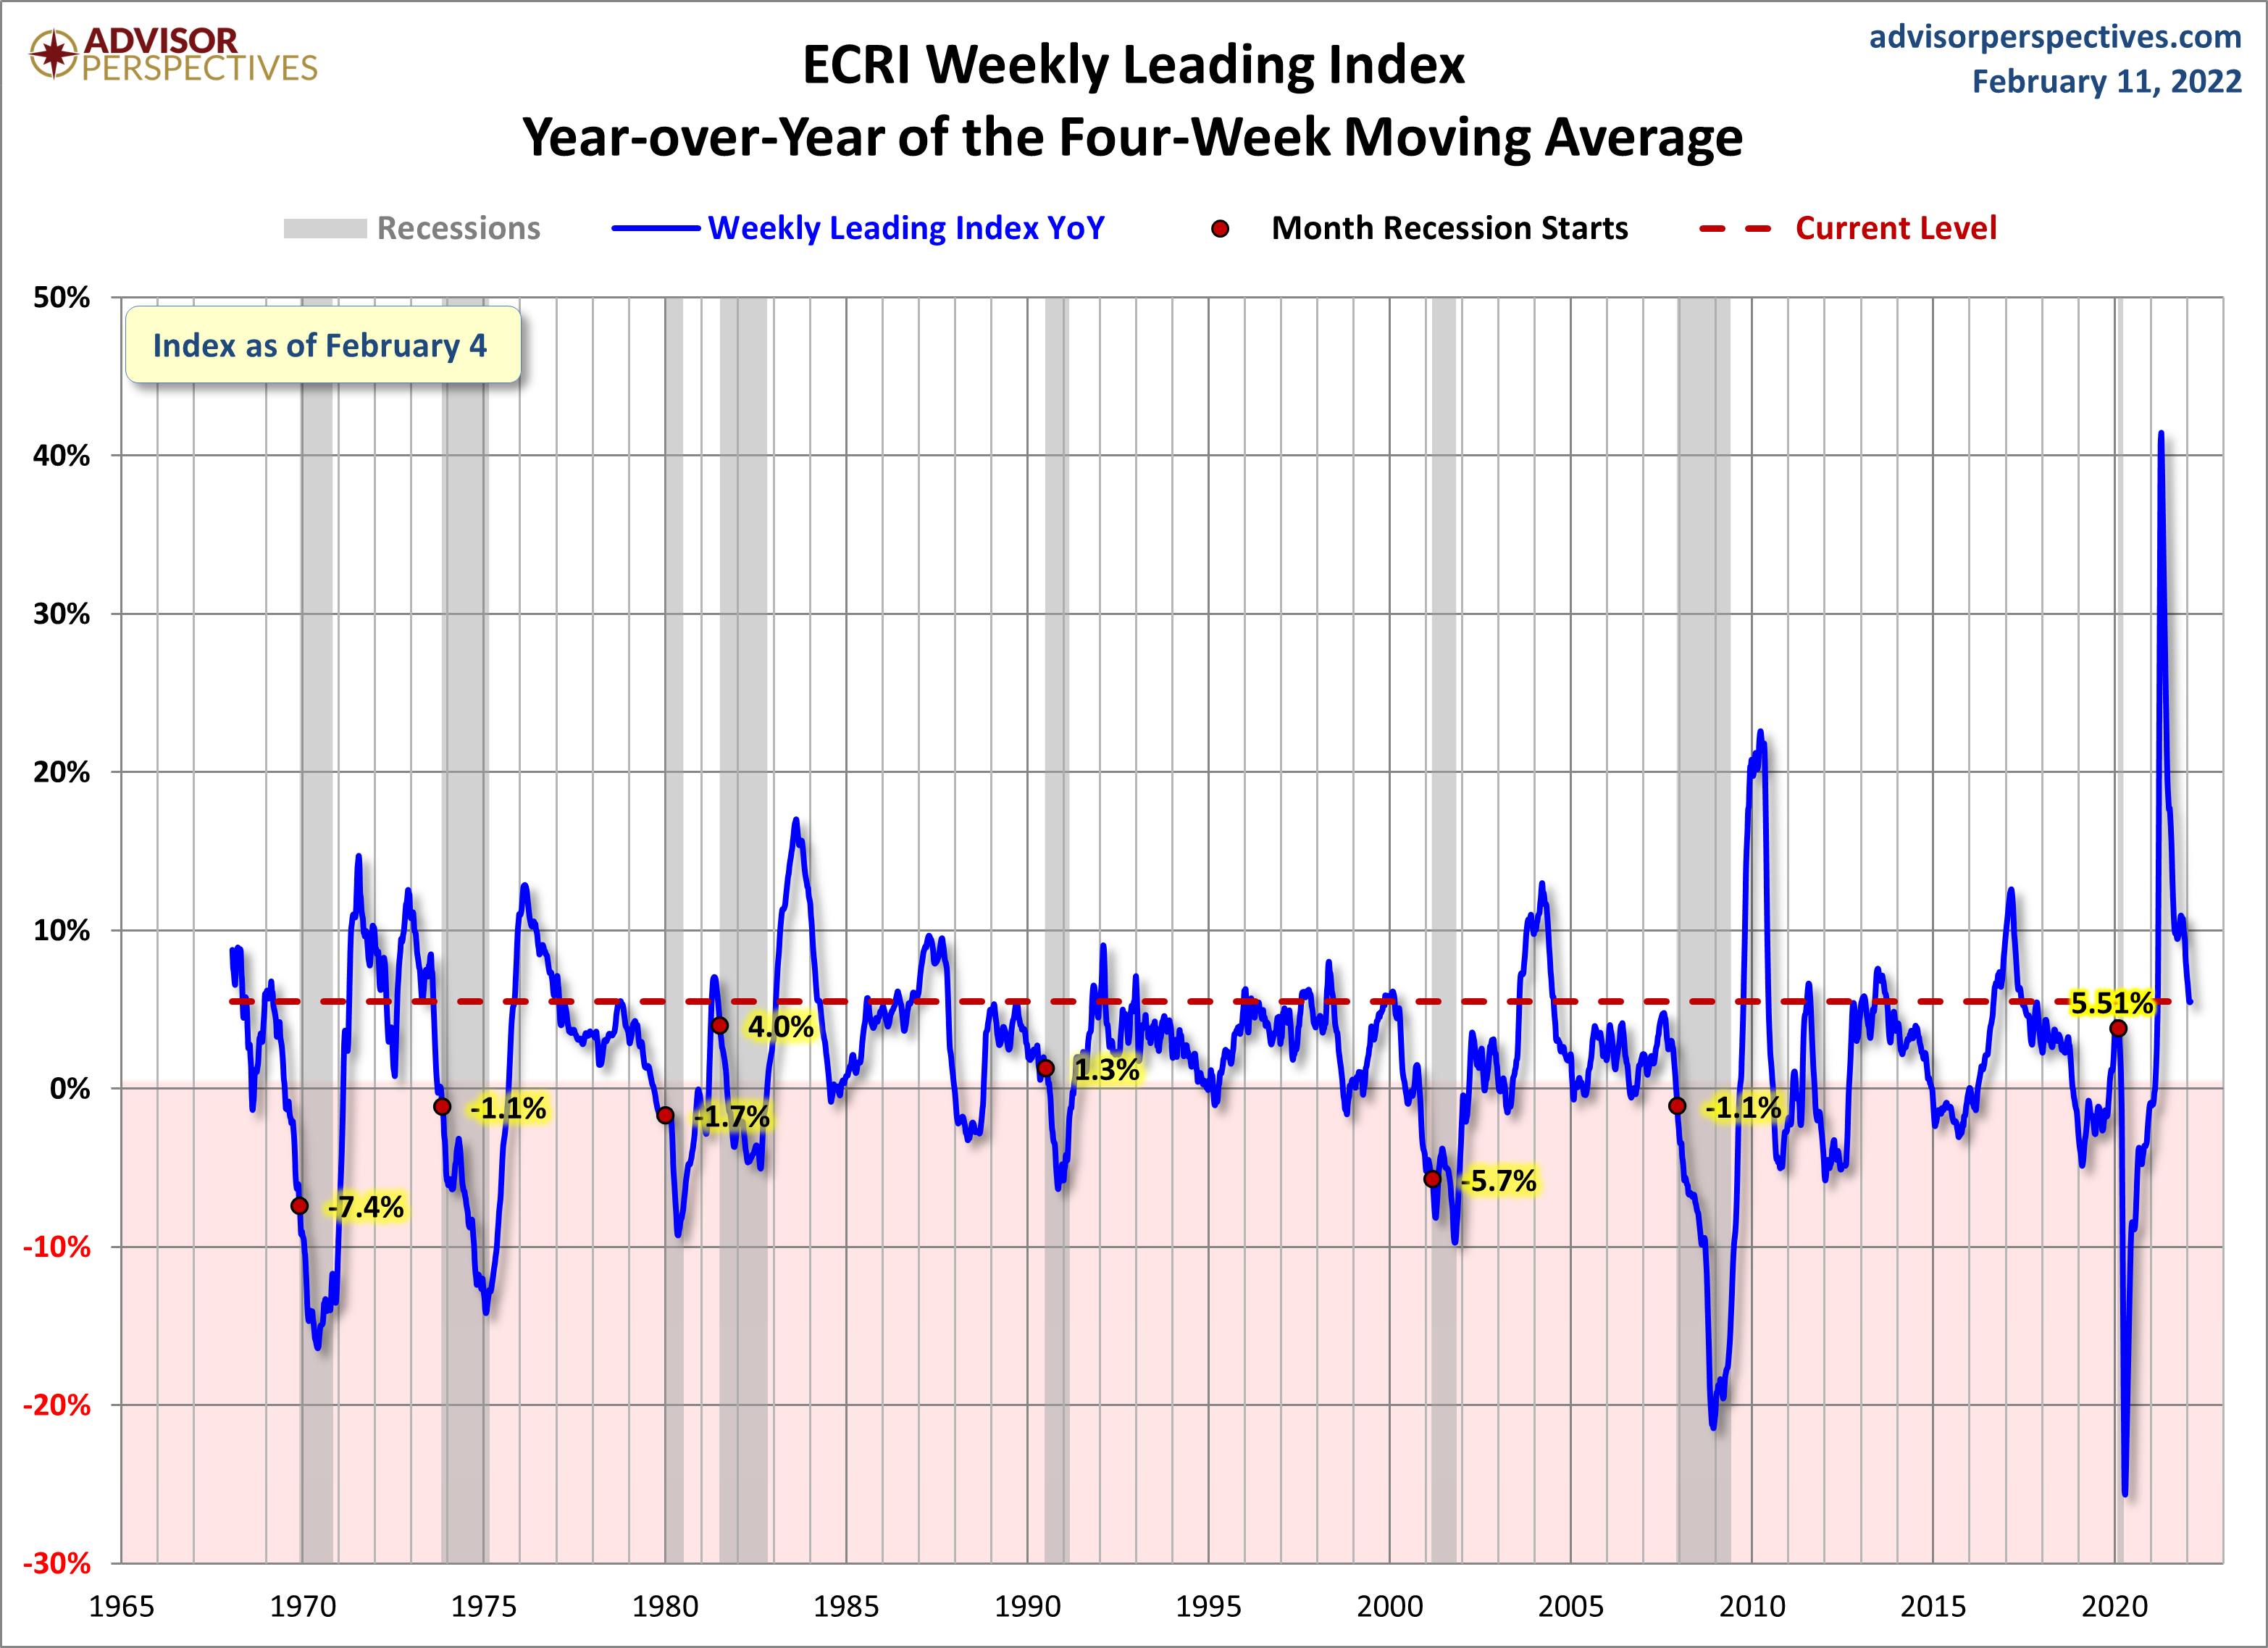
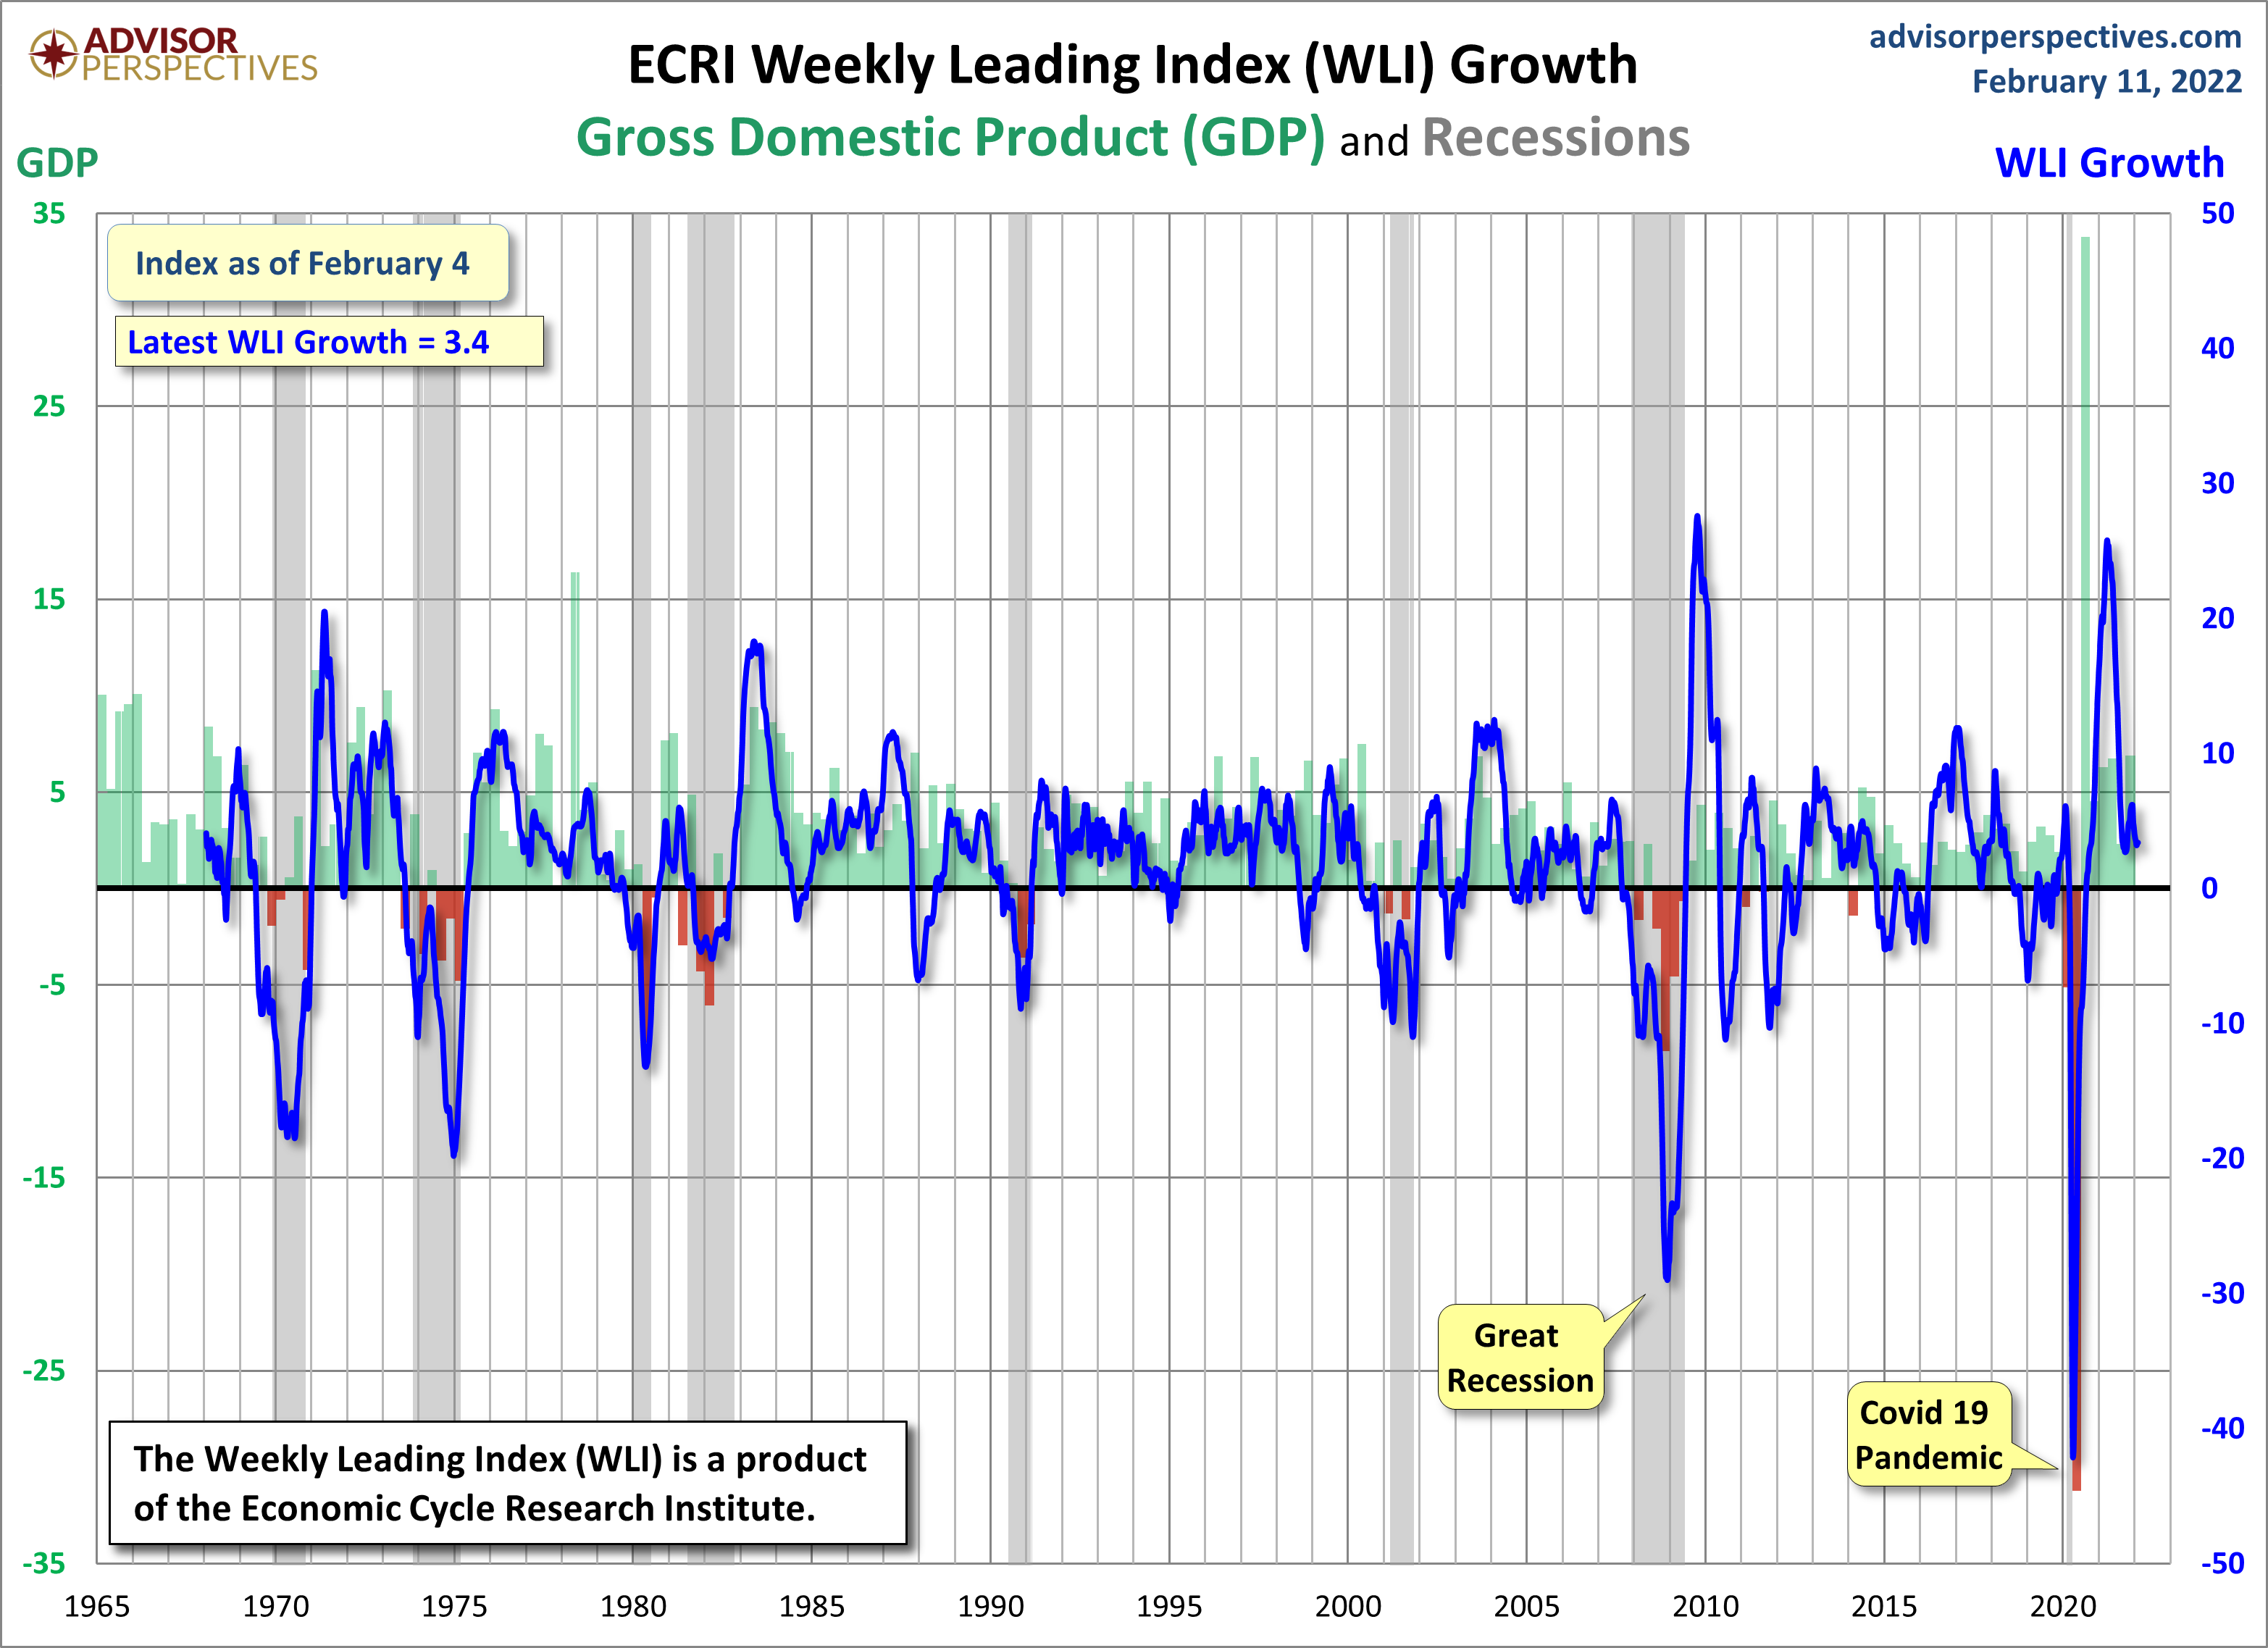
Below are three long-term charts, from Advisor Perspectives’ ECRI update post of February 11, 2022 titled “ECRI Weekly Leading Index Update.”  These charts are on a weekly basis as of the February 11, 2022 release, reflecting data through February 4, 2022.

Here is the ECRI WLI (defined at ECRI’s glossary):

ECRI WLI,Gr. 157.9

–

This next chart depicts, on a long-term basis, the Year-over-Year change in the 4-week moving average of the WLI:

ECRI WLI YoY of the Four-Week Moving Average

–

This last chart depicts, on a long-term basis, the WLI, Gr.:

ECRI WLI Gr. 3.4 Percent

_________

I post various economic indicators and indices because I believe they should be carefully monitored.  However, as those familiar with this site are aware, I do not necessarily agree with what they depict or imply.

_____

The Special Note summarizes my overall thoughts about our economic situation

SPX at 4490.44 as this post is written

Thursday, February 10, 2022

Chicago Fed National Financial Conditions Index (NFCI)

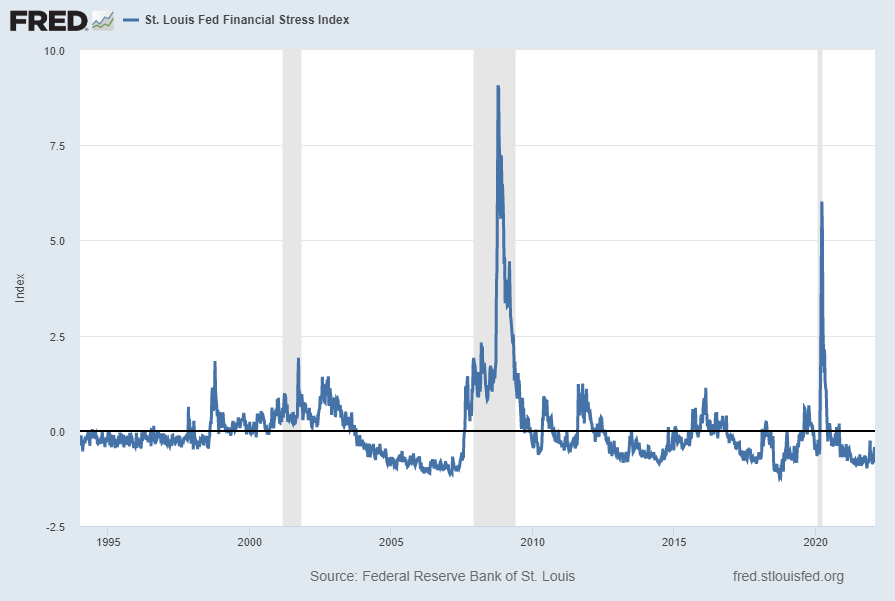
The St. Louis Fed’s Financial Stress Index (STLFSI3) is one index that is supposed to measure stress in the financial system. Its reading as of the February 10, 2022 update (reflecting data through February 4, 2022) is -.7650:

STLFSI3

source: Federal Reserve Bank of St. Louis, St. Louis Fed Financial Stress Index [STLFSI3], retrieved from FRED, Federal Reserve Bank of St. Louis; accessed February 10, 2022: https://fred.stlouisfed.org/series/STLFSI3

Of course, there are a variety of other measures and indices that are supposed to measure financial stress and other related issues, both from the Federal Reserve as well as from private sources.

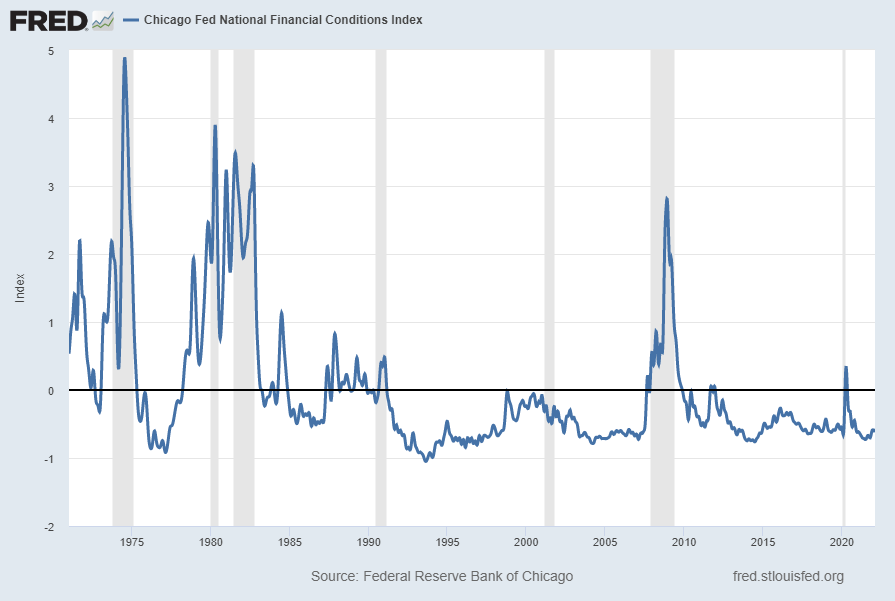
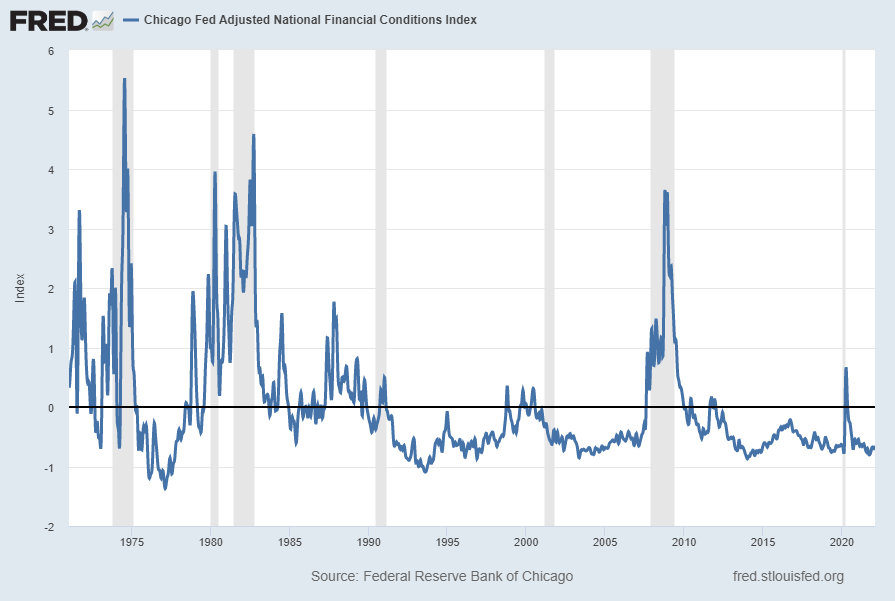
Two other indices that I regularly monitor include the Chicago Fed National Financial Conditions Index (NFCI) as well as the Chicago Fed Adjusted National Financial Conditions Index (ANFCI).

Here are summary descriptions of each, as seen in FRED:

The National Financial Conditions Index (NFCI) measures risk, liquidity and leverage in money markets and debt and equity markets as well as in the traditional and “shadow” banking systems. Positive values of the NFCI indicate financial conditions that are tighter than average, while negative values indicate financial conditions that are looser than average.

The adjusted NFCI (ANFCI). This index isolates a component of financial conditions uncorrelated with economic conditions to provide an update on how financial conditions compare with current economic conditions.

For further information, please visit the Federal Reserve Bank of Chicago’s web site:

http://www.chicagofed.org/webpages/publications/nfci/index.cfm

Below are the most recently updated charts of the NFCI and ANFCI, respectively.

The NFCI chart below was last updated on February 9, 2022 incorporating data from January 8, 1971 through February 4, 2022 on a weekly basis.  The February 4 value is -.57192:

NFCI

Data Source: FRED, Federal Reserve Economic Data, Federal Reserve Bank of St. Louis; accessed February 10, 2022:  
http://research.stlouisfed.org/fred2/series/NFCI

–

The ANFCI chart below was last updated on February 9, 2022 incorporating data from January 8, 1971 through February 4, 2022, on a weekly basis.  The February 4, 2022 value is -.65159:

ANFCI

Data Source: FRED, Federal Reserve Economic Data, Federal Reserve Bank of St. Louis; accessed February 10, 2022:  
http://research.stlouisfed.org/fred2/series/ANFCI

_________

I post various indicators and indices because I believe they should be carefully monitored.  However, as those familiar with this site are aware, I do not necessarily agree with what they depict or imply.

_____

The Special Note summarizes my overall thoughts about our economic situation

SPX at 4547.79 as this post is written

Charts Indicating Economic Weakness – February 2022

Throughout this site there are many discussions of economic indicators.  This post is the latest in a series of posts indicating facets of U.S. economic weakness or a notably low growth rate.

The level and trend of economic growth is especially notable at this time. As seen in various measures and near-term projections, the U.S. economy had undergone an outsized level of economic contraction in 2020. However, most people believe (and virtually all prominent economic forecasts indicate) that this historic level of contraction will have proven ephemeral in nature; i.e. an economic expansion will continue. 

As seen in the January 2022 Wall Street Journal Economic Forecast Survey the consensus (average estimate) among various economists is for 3.30% GDP growth in 2022, 2.42% GDP growth in 2023, and 2.22% GDP growth in 2024.

Charts Indicating U.S. Economic Weakness

Below are a small sampling of charts that depict weak growth or contraction, and a brief comment for each:

__

Advance Retail Sales: Retail Trade and Food Services (RSAFS)

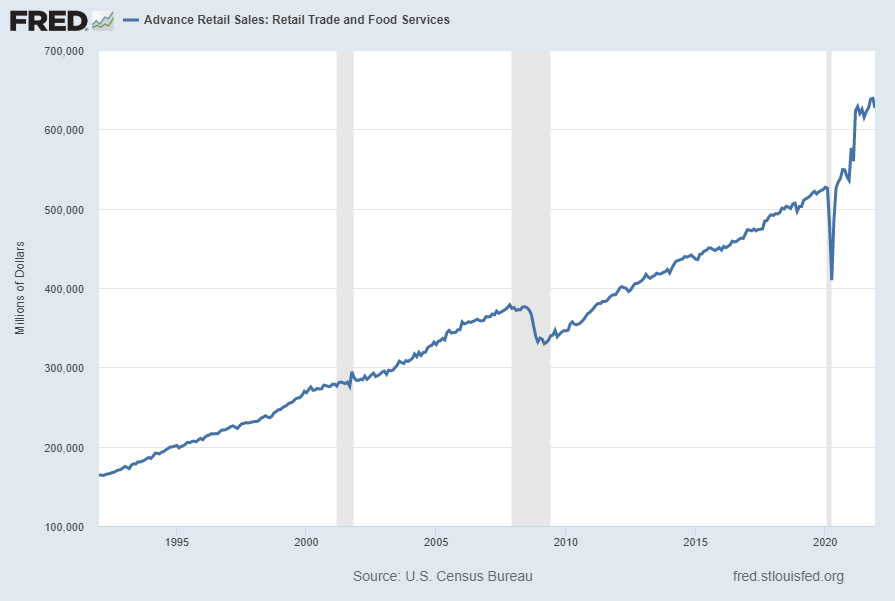
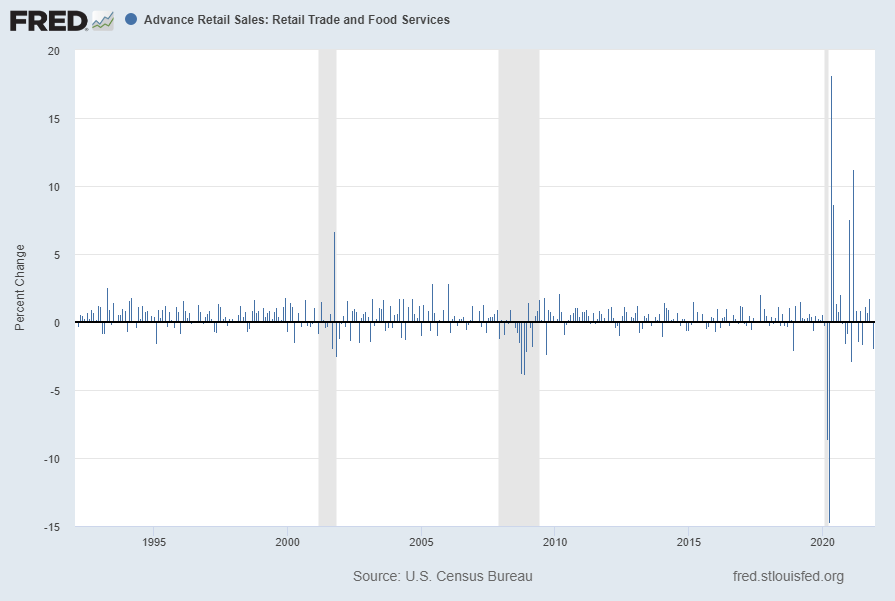
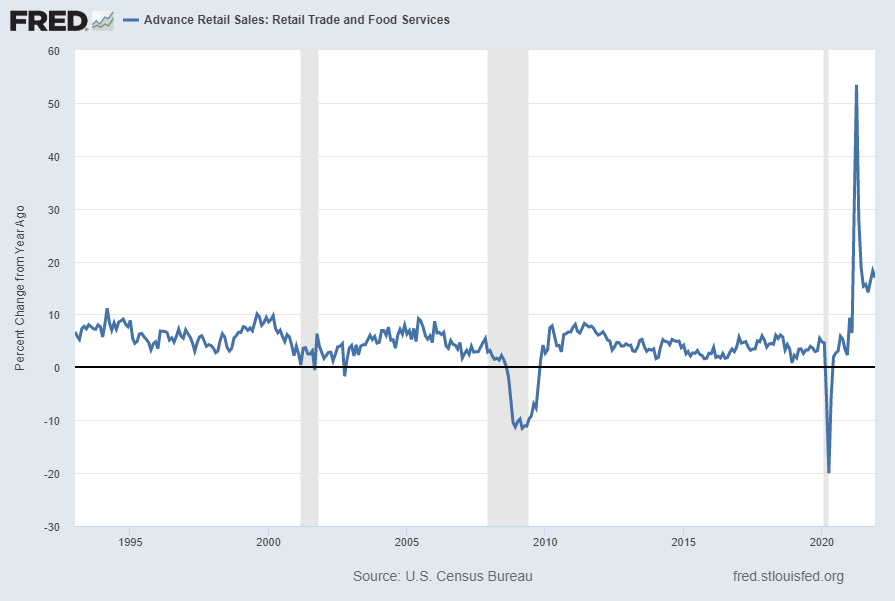
Advance Retail Sales: Retail Trade and Food Services (RSAFS), when viewed from a long-term perspective, has recently been volatile. While the trend when viewed from a “Percent Change From Year Ago” basis remains – as one might expect – robust, when viewed from a “Percent Change” (from the prior month) basis the growth trend appears less robust.

Shown below is this measure with last value of $626,833 Million through December, last updated January 14, 2022:

Retail Sales

Displayed below is this same RSAFS measure on a “Percent Change” (from prior month) basis with value -1.9%:

Retail Sales Percent Change

Below is this measure displayed on a “Percent Change From Year Ago” basis with value 16.9%:

Retail Sales Percent Change From Year Ago

source: U.S. Census Bureau, Advance Retail Sales: Retail and Food Services, Total [RSAFS], retrieved from FRED, Federal Reserve Bank of St. Louis; accessed February 9, 2022: https://fred.stlouisfed.org/series/RSAFS

__

Commercial And Industrial Loans, All Commercial Banks (BUSLOANS)

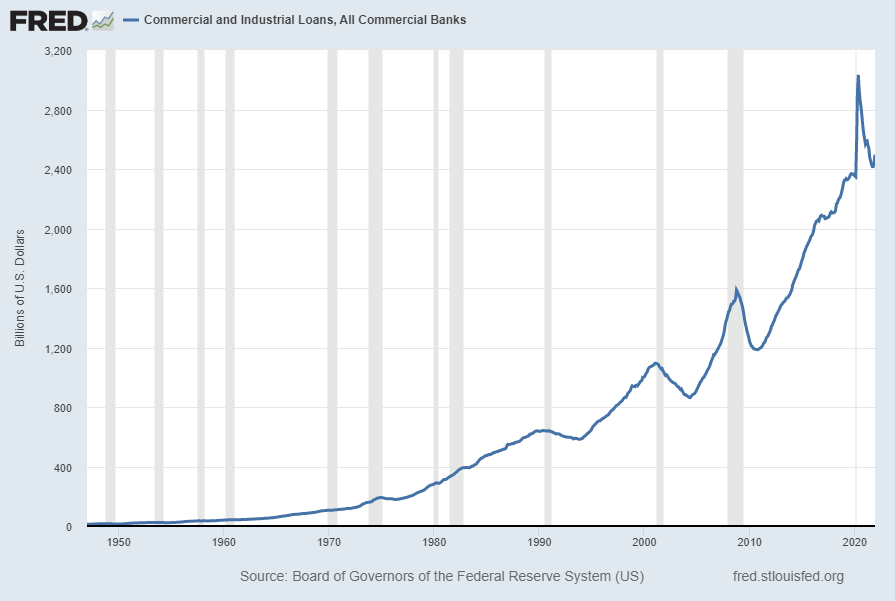
“Commercial And Industrial Loans, All Commercial Banks” (BUSLOANS) has recently been volatile. Shown below is this measure with last value of $2,495.7226 Billion through December 2021, last updated February 4, 2022:

Commercial And Industrial Loans

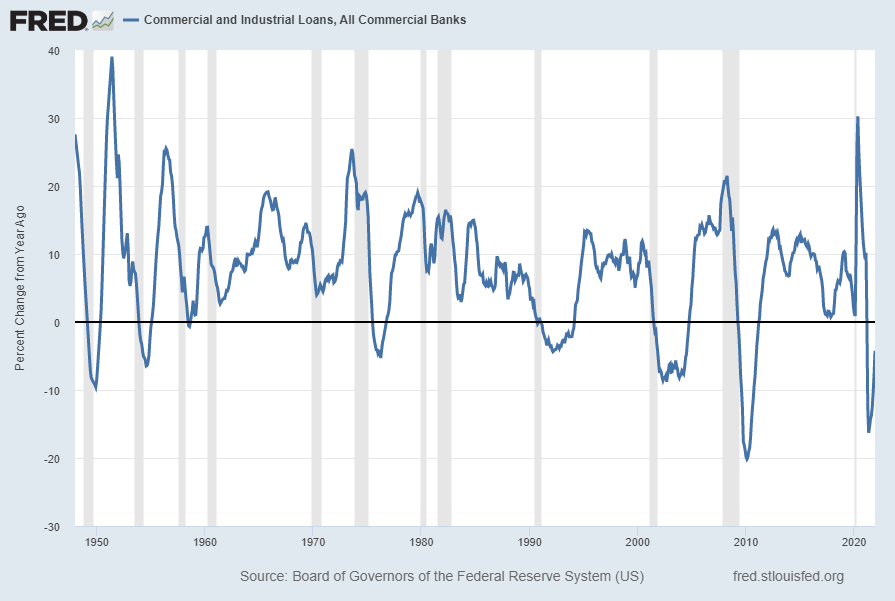
Below is this measure displayed on a “Percent Change From Year Ago” basis with value -4.2%:

Commercial and Industrial Loans Percent Change From Year Ago

source: Board of Governors of the Federal Reserve System (US), Commercial and Industrial Loans, All Commercial Banks [BUSLOANS], retrieved from FRED, Federal Reserve Bank of St. Louis; accessed February 9, 2022: https://fred.stlouisfed.org/series/BUSLOANS

__

The Yield Curve

Many people believe that the Yield Curve is a leading economic indicator for the United States economy.

On March 1, 2010, I wrote a post on the issue, titled “The Yield Curve As A Leading Economic Indicator.”

While I continue to have the stated reservations regarding the “Yield Curve” as an indicator, I do believe that it should be monitored.

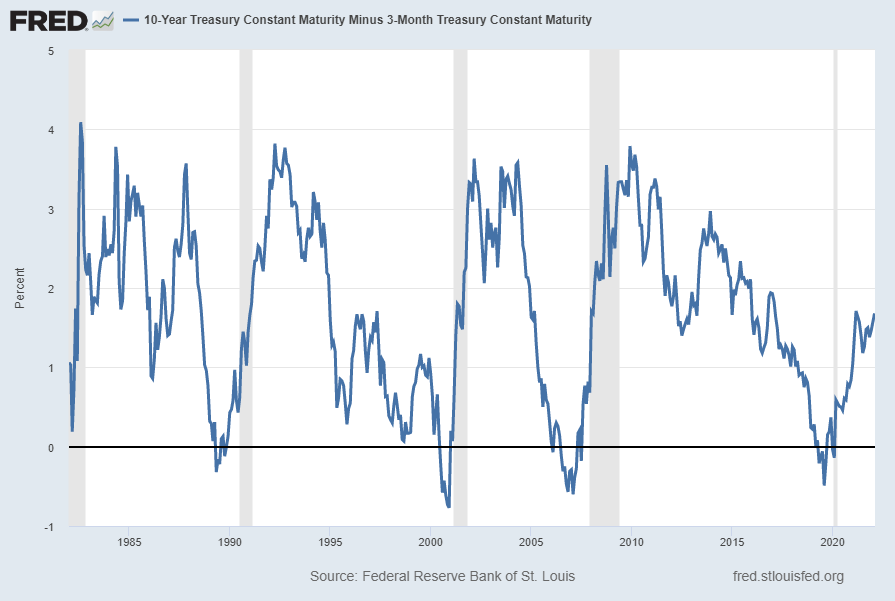
The U.S. Yield Curve (one proxy seen below) while positive, is (all things considered) relatively low when viewed from a long-term perspective. Below is the spread between the 10-Year Treasury Constant Maturity and the 3-Month Treasury Constant Maturity from 1982 through the February 9, 2022 value, showing a value of 1.68% [10-Year Treasury Yield (FRED DGS10) of 1.96% as of February 8, 3-Month Treasury Yield (FRED DGS3MO) of .25% as of February 8]:

10-Year Treasury Constant Maturity Minus 3-Month Treasury Constant Maturity

source: Federal Reserve Bank of St. Louis, 10-Year Treasury Constant Maturity Minus 3-Month Treasury Constant Maturity [T10Y3M], retrieved from FRED, Federal Reserve Bank of St. Louis; accessed February 9, 2022: https://fred.stlouisfed.org/series/T10Y3M

__

Industrial Production: Consumer Goods (IPCONGD)

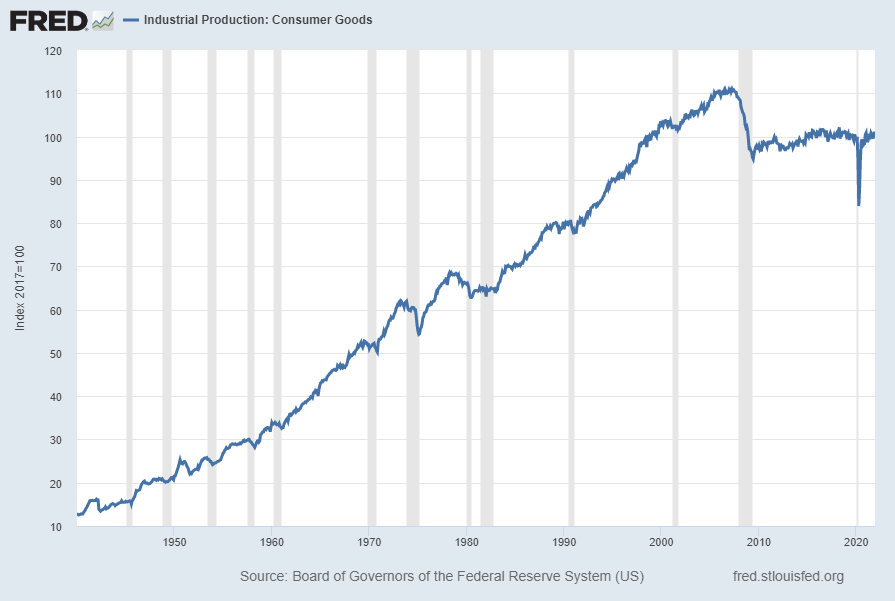
The “Industrial Production: Consumer Goods” measure has been relatively subdued since the Financial Crisis. Shown below is a long-term chart of this measure (displayed from 1939), with last value of 100.1636 through December 2021, last updated January 14, 2022:

Industrial Production - Consumer Goods

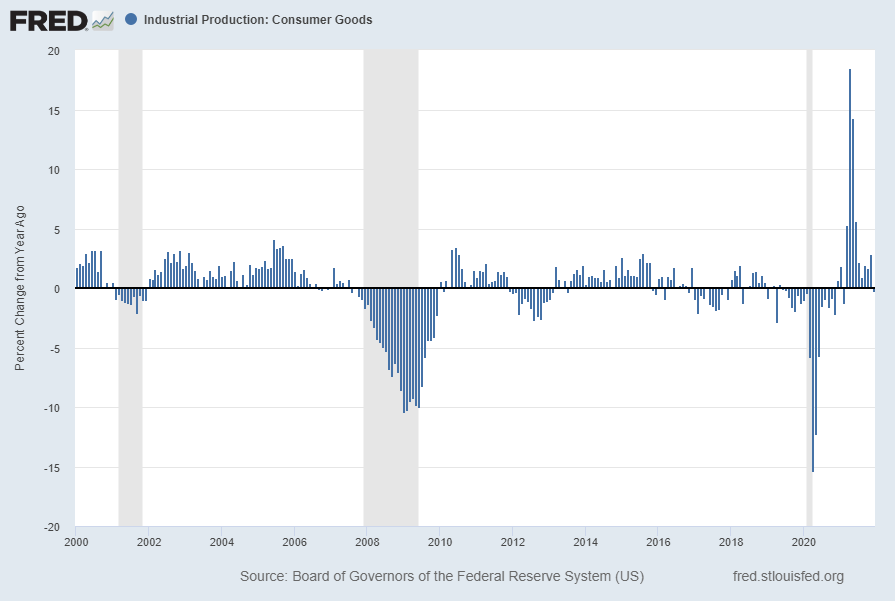
Displayed below is this same IPCONGD measure on a “Percent Change From Year Ago” basis. The current value is -.2%:

Industrial Production, Consumer Goods Percent Change From Year Ago

source:  Board of Governors of the Federal Reserve System (US), Industrial Production: Consumer Goods [IPCONGD], retrieved from FRED, Federal Reserve Bank of St. Louis; accessed February 9, 2022: https://fred.stlouisfed.org/series/IPCONGD

__

Other Indicators

As mentioned previously, many other indicators discussed on this site indicate slow economic growth or economic contraction, if not outright (gravely) problematical economic conditions.

_____

The Special Note summarizes my overall thoughts about our economic situation

SPX at 4587.18 as this post is written